
Why is the Memecoin Craze Bad for Crypto
How volume dispersion contributes for decaying momentum

Hey there, Pedma here! Welcome to this ✨ free edition ✨ of the Trading Research Hub’s Newsletter. Each week, I'll share with you a blend of market research, personal trading experiences, and practical strategies, all aimed at making the world of systematic trading more relatable and accessible.


If you’re not yet a part of our community, subscribe to stay updated with these more of these posts, and to access all our content.
For the past few months the crypto sector in general has been quite weak. For those of us that were expecting a stronger first quarter, it has been quite disappointing to say the least. In the meantime, to make full use of a slow market, we’ve been launching new models, improving our articles and making our testing and production code more robust.

Today we’re going to look at some data, and analyze what I believe has been a driving factor of this stagnation in the crypto sector. I’ve added a lot of data to this report, and I will continue to improve it. If you enjoy these kind of more data driven market reports, let me know, as I guide this newsletter by your valuable feedback.
Macro View
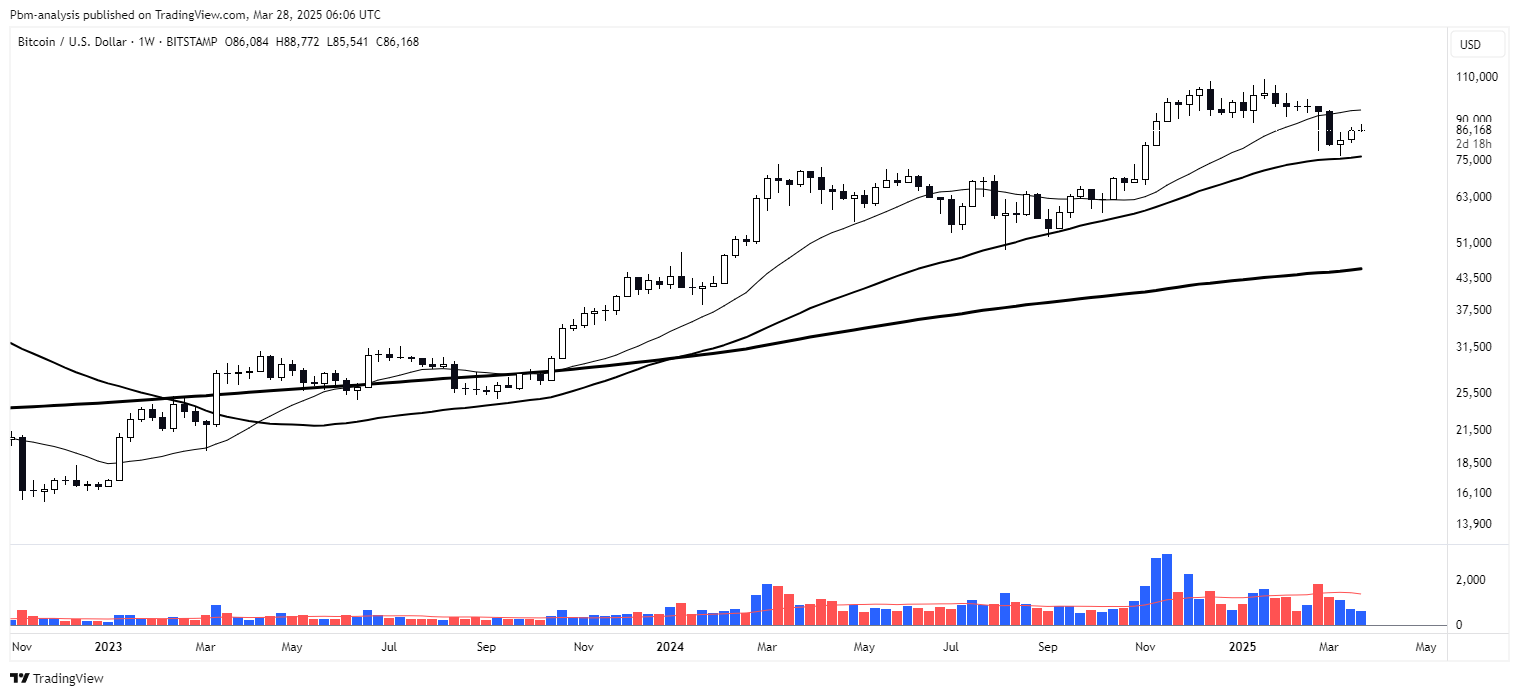
Let’s take a look first at Bitcoin. We’re back at November 2024 price levels, despite all the promotion (good or bad) from the current U.S. administration. In the past, any positive mention from a “mainstream” individual or institution would drive prices higher. These days, every news seem like old news.
I am not going to pretend that I know for a fact what’s going on, I am not a macro guy, just a systematic trader. But my view of markets is that they are forward pricing machines. From 2023-2024 market participants have been pricing in a more “lenient” administration towards the whole industry. This created a general trend in Bitcoin that we observed going into the elections. Once elections were over, that event was already priced in.
Now the entire industry have nothing to look forward other than the amazing creation of value (*sarcasm*) of FARTCOIN type “assets”. Everything has been turned into a meme, and a significant portion of volume, has flowed into these gambling driven assets that produce absolutely no value to the space. New projects are created for the premise of gambling and selling higher to new uninformed participants. Presidents, countries and influencers launch their memecoins only as vehicles of value creation to themselves.
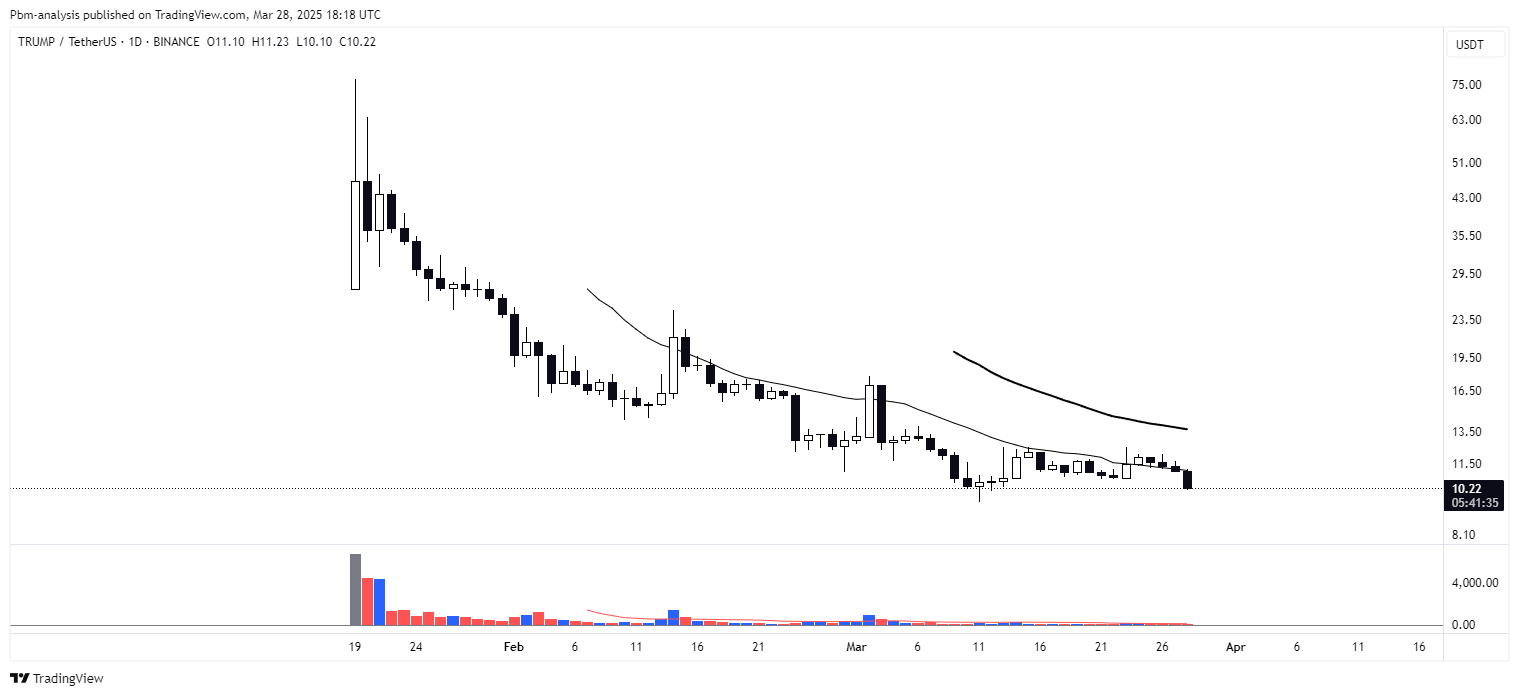
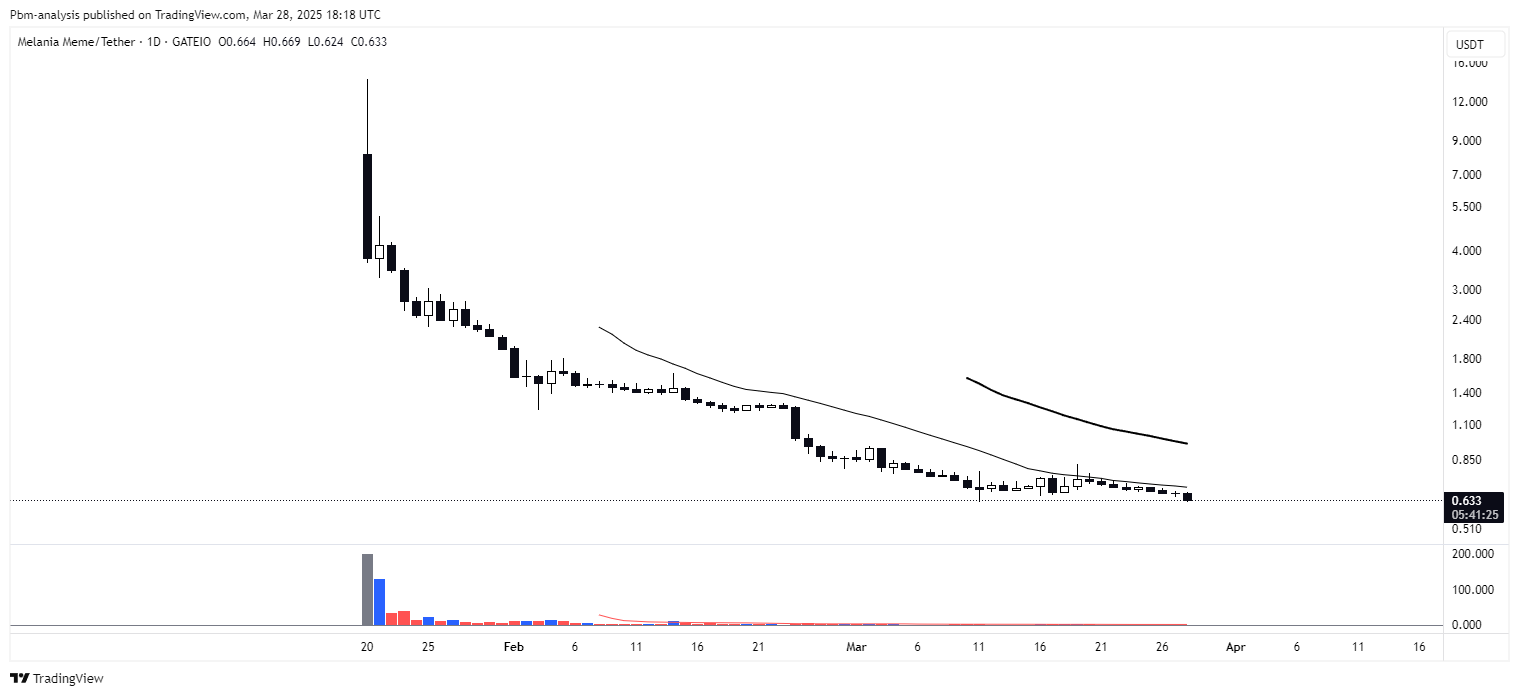

The examples from the last few months are endless. To be honest, it’s pretty embarrassing to be known for operating in this space, and I usually avoid conversations with friends and family that I invest in crypto.
Now all of this dispersion is reflected in total crypto market cap (excluding the top 10 coins by market cap). We are at the same levels we saw back in March 2021!!

There were some great periods in between there to trade, definitely, but there has been weak to no demand for these assets since then. This means that price discovery is only a mirage of a distant past.
The number of cryptocurrencies above the $100M market cap have been growing exponentially since 2021. This means that with stagnant prices, and an increasing number of new coins, the space is becoming more and more scattered than it once was.

Back in the day, you’d get the whole attention to a few coins, meaning that momentum was more explosive. Now, given the level of scattered volume that we’ve seen over the last year or so, these bursts of momentum are less frequent and also less pronounced when they occur.
Let’s take a look at the data, of how momentum has evolved across time.
I’ve analyzed data since 2017 just to make the point that it definitely has been decaying and to me that is both the sign of a maturing market, but also of dispersion.

The more assets you have, the more capital is scattered, the less absolute momentum we get in individual coins. This in itself is not a bad thing, U.S. equities have over 5,000 companies, and it has not killed that market right? But it is a factor to consider when making broad generalizations about what crypto once was and what it is today.
Let’s take a look at volume and volume dispersion. If what I just said about volume being scattered is accurate, we should see that reflected in the average dollar volume per asset. Let’s take a look at it below.
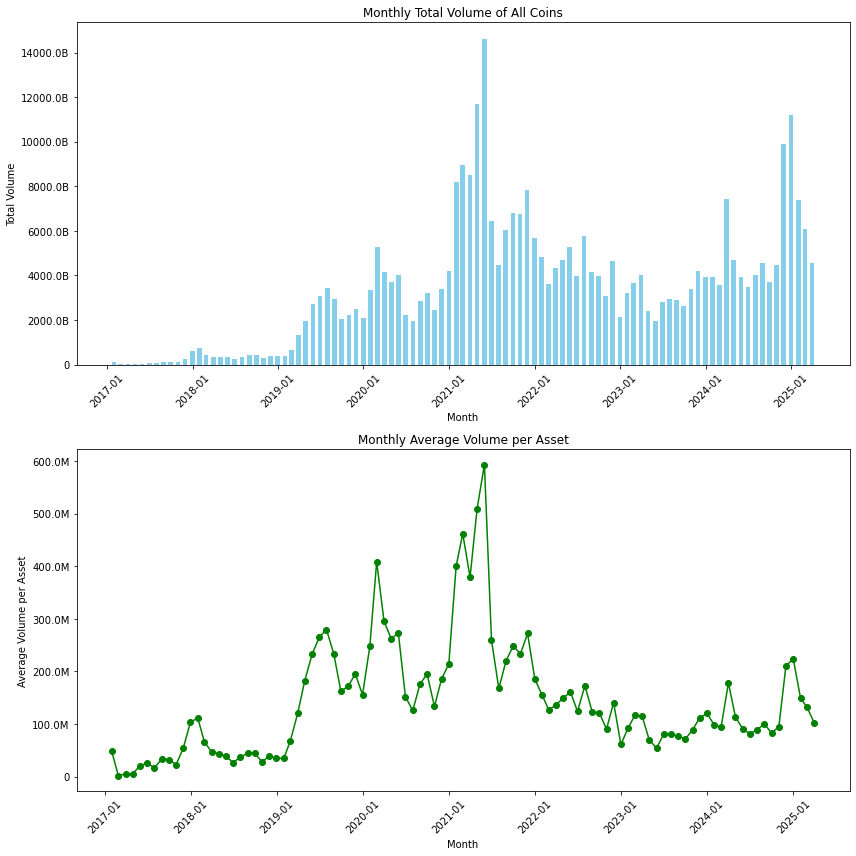
We can see that even though the total volume traded has been increasing, the average volume per asset has been declining significantly. More showing how scattered the market is becoming.
Let’s analyze the groups where the total volume share falls into. We can see that the volume is highly skewed towards the large cap and above, representing over 90% of the total volume share.

But let’s zoom in a bit further.

We can see that the nano, micro and small caps volumes have been growing over the last few years. This is in line with our argument above about the lower quality gambling type asset craze we’ve seen this cycle.
Back in 2020, these smaller caps represented 1.3% of the total volume share of the entire market. In 2024 they represented over 3.5%, and in 2025 they already represent 4.7% and the year isn’t even over!

Below is also the growth in volume over the years for the nano cap category. We can see how large this trend has become.

What does this mean for the market? Well, in my view, until something fundamental changes, strength will be scattered as long as traders continue to pick gambling vehicles rather than quality type assets within the crypto space. The space needs more value creation and real world applications and not be just a vehicle for gambling and libertarian ideas. Bitcoin, I do believe will continue to grow and demand for it is ever increasing. However we need something else to drive demand forward for other crypto assets, and it isn’t by being simple gambling vehicles.
Technicals
I like to evaluate momentum in the markets I trade. That is what drives most of the returns of my models. If we look at the percentage of cryptocurrencies above their rolling averages, we can see that they are at minimum levels.
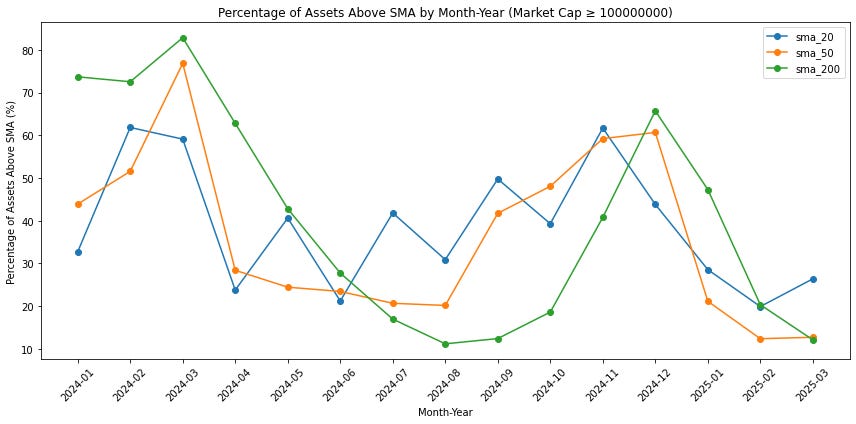
This means that only 20% of total crypto assets we’ve analyzed, currently stand above their short-term and long-term rolling averages. In simple terms, broad downtrend!
There’s really not been much action in the market, despite the first quarter of the year having an historical tendency to be stronger. Here’s what crypto looks like in a seasonal basis.

I am definitely preparing myself to not be here in the summer. It’s slow, there’s not much to do, and I want to be prepared for the end of the year which tends to be usually stronger. In any case, my models are mostly automated, so it isn’t like I have to be here every day watching the charts, the work is already done and all I have to do is manage my systems and making sure they are doing what they are supposed to do.
Despite all of this weakness, there has been a few outliers that are worth mentioning. For this analysis, I’ve normalized the movement both of Bitcoin and general altcoins, and measured them against each other. Here are the top 10 movers against Bitcoin.

Obviously that non of them are an endorsement to buy, I don’t trade like that. But I think it’s valuable to have a sense for what are the performers in this weak market.
If we’re running momentum based strategies, which I am, we also took a hit due to the weak momentum we currently see in these markets. This is natural and we should expect it.

The game of investing and trading is one of patience. Markets aren’t always going to agree with us and that means we are going to experienced drawdowns and slow performance. That is just part of business and there’s no point in trying to outsmart it. We can try to add more markets and diversify, that is a smart thing to do. Diversification is the only real free lunch in markets. But it’s a highly complex task and requires specialized knowledge. In 2025, I am planning on adding more markets into my book, to further increase the sharpe of my overall portfolio. In the meantime, we patiently wait for better times…
We’re going to add more data to these reports in the future, feel free to let me know what you’d like to read about or if you have any suggestions below.
Wish you an amazing weekend!
Ps… Looking to Work With Me?
After testing 100’s of trading strategies and spending 1,000’s of hours studying trading and building my own models, I had a few clients reach out to work with me and the outcomes have been quite good so far!
I’ve helped multiple clients now:
Develop their first systematic model
Help reviewing their current trading processes
Build solid frameworks on trading system development
Stop wasting money and time on bad ideas
Develop better risk management models
And much more…
If you want my custom help on your trading business, or would like to work with me, book a free 15-minute consultation call:
And finally, I’d love your input on how I can make Trading Research Hub even more useful for you!
Disclaimer: The content and information provided by the Trading Research Hub, including all other materials, are for educational and informational purposes only and should not be considered financial advice or a recommendation to buy or sell any type of security or investment. Always conduct your own research and consult with a licensed financial professional before making any investment decisions. Trading and investing can involve significant risk of loss, and you should understand these risks before making any financial decisions.
high cost of borrowing + tight liquidity / quant tightening = increase in btc.d = alts struggling. better liquidity (tax cuts, reduced levels of QT) have the potential to help alts. time will what feds do.