Parameter Diversification: The Key to Robust Trading Strategies - Research Article #64
Using multiple lengths of a signal to capture market regimes without overfitting
👋 Hey there, Pedma here! Welcome to the 🔒 exclusive subscriber edition 🔒 of Trading Research Hub’s Newsletter. Each week, I release a new research article with a trading strategy, its code, and much more.
If you’re not a subscriber, here’s what you missed this past month so far:
If you’re not yet a part of our community, subscribe to stay updated with these more of these posts, and to access all our content.
There’s a lot of of indicators (signals) out there to choose from. There’s even more combinations of frequencies and lookback periods.
So when we are building a trading model, the question naturally comes up:
"What is the optimal length to pick for my signal?
Should I choose the 20-day period for short-term trends or the 100-day period for long-term trends?”
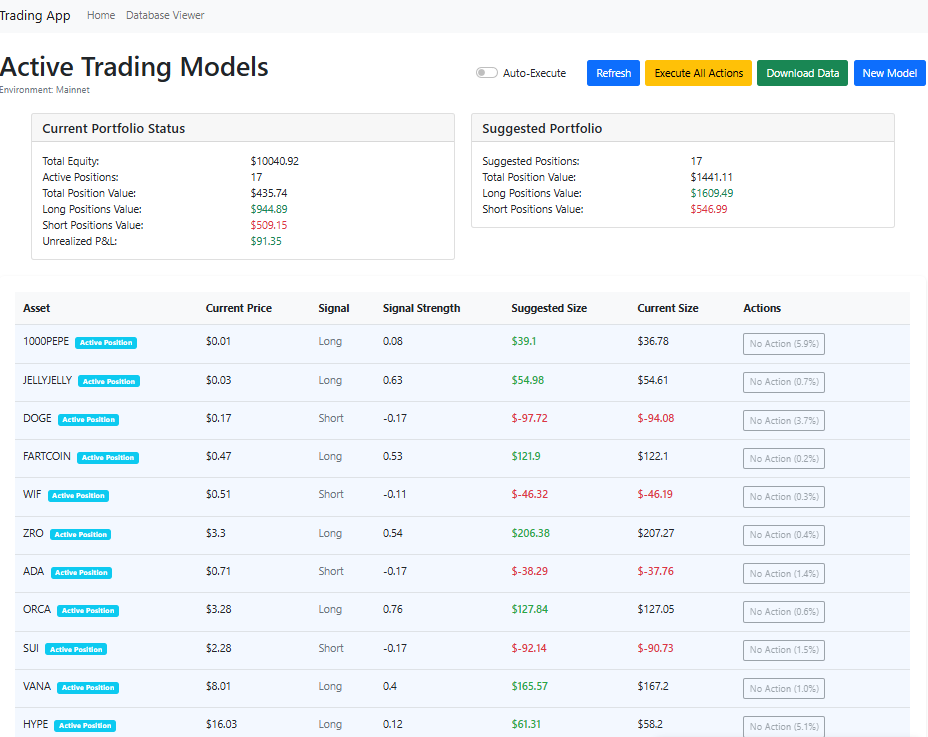
Now that we have our money machine operational (just kidding), we need to start thinking about what kind of features we’re going to add to the model. My goal is to achieve the best risk-adjusted returns without overfitting.
Yes, this trading portfolio will be made public, and the specific signals we’re trading will be made available to the premium subscribers of this newsletter.
Many traders look at the question of parameterization from an optimization perspective. They then proceed to optimize the parameters to the best one for their data. But as we know, this comes with large risks.
Markets are way too noisy for us to be able to pick a best thing that answers our questions.
What I view as optimal, is that if our signal truly has edge, we apply a wide net of parameters for that signal, and trade them all.
Rather than relying on that single parameter for our models, even if one starts decaying, we are no longer just exposed to it and the others should help maintain our performance.
Let’s think about the scenario where momentum in the markets we trade is favoring short-term systems and our lookback periods are only longer-term in nature… This means we won’t be making any returns and we are left hoping that the market favors our signals in the future. However if we have a nice blend of lookback periods, we can be exposed to different regimes in the market, while at the same time capturing the same underlying effect.
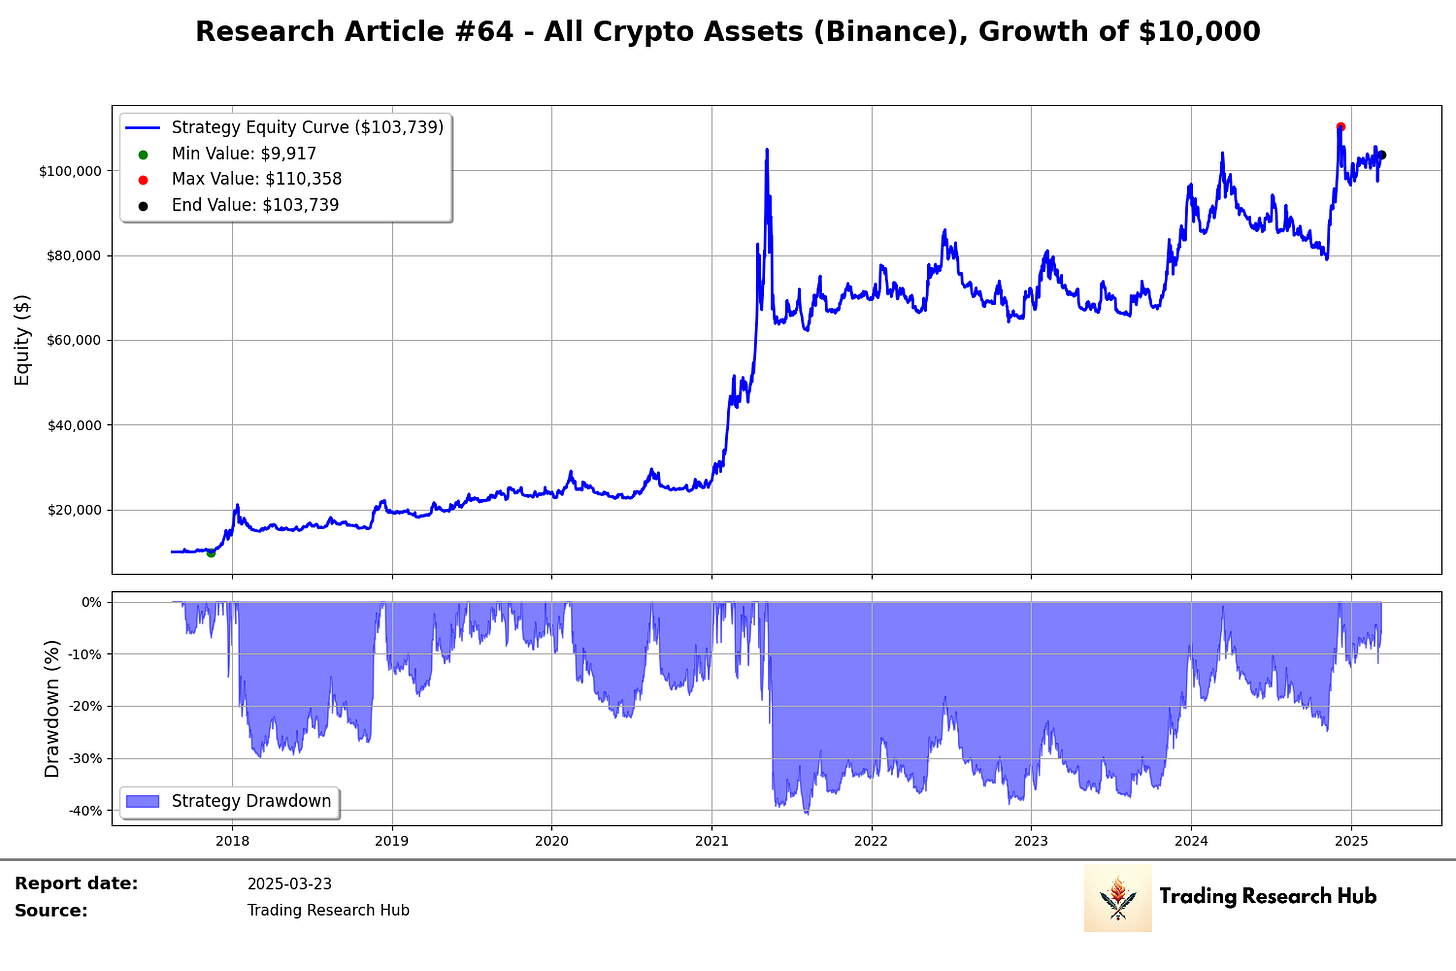
What sets this approach apart is its focus on risk-adjusted returns rather than headline-grabbing gains. While others chase the next 100x trade, our strategy has demonstrated remarkable consistency, with Sharpe ratios ranging from 0.97 to 1.34 across different variations of the strategy.
Even when the market is negative, the strategy produced positive risk adjusted performance every year.
This means you're not just generating returns – you're doing it with significantly less volatility than traditional trading approaches.
In the following sections, I'll break down:
How this strategy works.
The specific indicators.
Positioning rules.
Risk management principles that make it effective.
You won't find any black boxes or proprietary secrets here – instead, you'll get a clear, actionable framework that you can implement immediately in your own trading.
Let’s dig into the article!
Table of Contents
Introduction
Data and Methodology
Performance Analysis
Conclusion
Data and Methodology
Core Strategy Setup
The strategy implements a continuous signal system using Bollinger Bands across multiple lengths:


