🤖This 1 Method is Worth More Than 100 Backtests - Research Article #50
How to build a trading strategy we are confident about?
Hey there, Pedma here! Welcome to this ✨ free edition ✨ of the Trading Research Hub’s Newsletter. Each week, I'll share with you a blend of market research, personal trading experiences, and practical strategies, all aimed at making the world of systematic trading more relatable and accessible.
If you’re not a subscriber, here’s what you missed this past month so far:
If you’re not yet a part of our community, subscribe to stay updated with these more of these posts, and to access all our content.
Today is our 50th edition of the Research Article Series 🎉.
What was once just a side project of mine, has become a tool that has helped a lot of traders navigate the shady world of retail trading, and something that I am really proud off.
My mission is to provide you with a content source, written by someone actually in the trenches of the market, with real-life experiences, running my own trading models.
If you are not part of the community yet, here’s a limited 20% discount on the yearly subscription:
I really appreciate your support, and I hope you take as much value as you can from it!
Backtesting alone won’t get you very far in trading.
Think about how many online backtesting tools there are available for free today, making it super easy for anyone to backtest any set of rules.
Yet, 97% of traders, are still unsuccessful!
Why is that the case?
… are they all dumb?
… are they all undisciplined?
Maybe, but I think that might be a naive and simplistic way of analyzing this problem.
My belief is that something else is required to find true edge in the markets.
Most people completely skip ahead and go right to backtesting mode.
… using rules that they have no idea about if they have edge or not, in the hopes to find something that works.
The problem is that by putting a bunch of bad ideas together, won’t make you find a good model.
You might find an illusion of a good model, but that will in time reveal to be a costly bet.
We often hear this expression for data engineering:
Garbage in, garbage out.
But data is not the only place where that is applied. Backtests also!
All comes down to having an edge or not.
And that is what we will explore today.
Index
Introduction
Index
A Chef’s Story
How To Find Good Signal
Signal Correlation with Future Returns
Immediate Signal Impact
The Validation Tool
A Chef’s Story
A young man named Marco lived in a small village.
Marco had one dream.
To become the greatest chef in the land.
He spent countless hours studying the cookbooks, watching cooking shows and following recipes to the letter.
With the internet at his fingertips, he could access every culinary technique ever created, and he believed that this would be the path to success.
One day, Marco found an online tool that made this process a lot easier.
It was a recipe generator.
He would just type in the ingredients and it would create a perfect dish every time.
Marco was really happy.
He then starts experimenting with this tool.
The recipes it generated were beautiful on paper, with precise steps and perfect cooking times.
Marco followed each one with precision, but when he served the meals, something was always missing.
The dishes looked fantastic, but the flavors?
Bland.
The textures?
Uninspiring.
His guests left unsatisfied and Marco began to lose confidence in his dream.
He couldn’t understand it… after all, the recipes were perfectly created from an endless pool of data and cooking methods.
One evening, his mentor, an old master chef named Luca, visited his kitchen.
Marco explained his problem showing him the perfect written recipes. Luca smiled and sat down at the table.
“Marco”, he said, “recipes are like maps, but they don’t show you the full journey to a finished dish. You can’t become a great chef by following instructions alone.”
Marco frowned. “But the recipes are perfect. I’ve tested so many and they all seem right.”
Luca chuckled. “Testing recipes only shows what works in theory, not what truly makes a dish great in practice. What you’re missing is the heart of cooking—understanding the ingredients, the essence of each flavor, and knowing when to break the rules.”
He pointed to a pot of boiling soup.
“You’re following the recipe’s timing, but the ingredients might need more time, less heat. You need to feel it. Research your ingredients first. Know what makes them shine, how they react to heat, how they blend with others. Only then will you create something truly remarkable.”
How To Find Good Signal
Like Marco, we need to focus on our ingredients first, and not on the recipe.
How do our signals impact the market?
How do they react with other things at the same time?
What information do they provide us?
These are all questions we must answer before even thinking in our recipe, “aka” our backtest.
If you want my custom advice on your trading business, or would like to work with me, book a free 15-minute consultation call:
Let’s begin by defining the process of how to find good signal.
I want to say that math is helpful here, but it’s not the be all end all.
I’d trade a mathematician for a great retail trader, with super high intuition about proper market behavior.
Not because the latter is better, but because it’s more applicable to trading P&L, rather than theoretical (many times) nonsense.
The first thing we want to do is to start with a solid understanding about market behavior.
If we’re just “feeding” random signals into a machine, odds are, we are going to get caught in the endless spiral of overfitting.
There’s a few simple things we know about markets:
For fundamental reasons, some assets tend to move together.
For group behavior reasons, certain shocks in demand/supply are expected at certain calendar dates.
And for no apparent reason at all, there’s trend and momentum (just kidding ahah). In my opinion, even though debated a lot, it’s also a group behavior thing, everyone likes to buy things that are moving up and sell things that are moving down. Causing this behavior of sustained price movement that we tend to call momentum or trend.
To summarize, the basic idea is that we want something fundamental, that drives market impact.
Today we’ll look into trend signals.
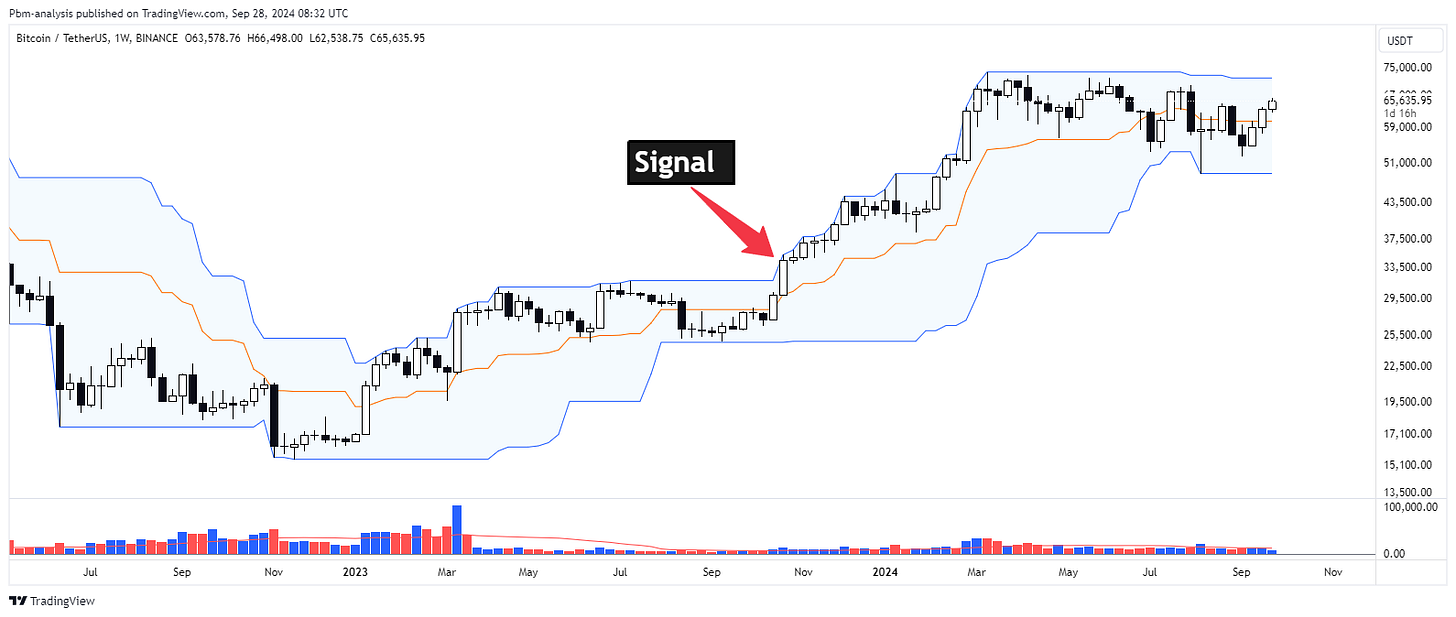
The Breakout is the simplest possible signal that is most known to anyone that has entry level knowledge of trading.
The second one will be a Bollinger Band breakout.
The next one we could look at will be a SMA Crossover.
And the 4th signal is going to be a RSI signal.
These are not meant to be amazing signals, they are meant to be signals that we understand, that could be used to model some effect we want to be exposed to.
Signal Correlation with Future Returns
Now that we have our signals, we want to understand how they correlate with future returns.
Like Marco, we want to understand what impact our ingredients have in our dish.
And we need to understand those ingredients, to the very core.
But how do you measure the impact of those variables, in future returns?
Let’s start with a simple mathematical model: “After we get signal (x), what are the returns (y), after time (t).”
Cephalopod has this great thread around this subject, which we’ll briefly look into.
Let’s start by calculating the correlation between signal and future returns.
We compute the returns after the signal, and then we calculate the correlation of those 2 variables.
Don’t get scared by the formula, it’s rather simple:
And you can fairly easily compute it using python:
# Function to calculate overall Information Coefficient
def calculate_overall_ic(df, signal_column, return_column='vol_adjusted_return'):
    df = df.dropna(subset=[signal_column, return_column])
    if len(df) > 1:
        ic, _ = pearsonr(df[signal_column], df[return_column])
        return ic
    else:
        return np.nan
The idea is that, we want to find a strong linear relationship, with future returns.
Here’s what we got:
We can see that for Bitcoin, within our universe of signals, the signal with more information is the bollinger band signal.
We actually talked about it last week:
This shows a positive and strong relationship between the signal and future returns.
I am not the only one that has discovered this to be the case in crypto, there’s other trend-followers that have the same findings on the data:
Immediate Signal Impact
One of the things that Marco’s mentor told him, was that he needed to “listen” to the ingredients, and feel when they needed more or less heat as they were being cooked.
The cooking time varies by different factors that need to be studied, and a generic rule is not the most appropriate.
Same with our signals.
In general, if our signal is good, it will have high market impact early on, and decay over time.
Why is this the case?
It's very hard—if not impossible—to find a signal that grows stronger over time.
It's more like an earthquake: the initial impact is always the strongest, followed by aftershocks that get weaker and weaker.
Is this applicable to our example?
Let’s find out.
Instead of using the standard correlation with future (x) returns, I’ve just added a bunch of windows to the calculation.
The best indicator, the bollinger band, does have that strong impact in the first few bars, and drops after a while.
James also mentions here that the cumulative PNL from a signal as a function of time will tend to look like this curve:
When I simulate a buy order on the signal, this is what the cumulative returns curve looks like:
The same behavior James mentions above.
Quite strong P&L from the start, and a decay right after.
This is quite interesting.
We start to understand the dynamic of our signals much better.
Had you just fed a bunch of rules together, you wouldn’t have known anything about the individual ingredients, but only the final generic recipe.
And if it wasn’t bad in the testing, it would almost definitely be bad once deployed.
We want real market impact and not illusions driven by data.
The Validation Tool
A backtest is a mere validation tool.
Now that we’ve done the proper research, thought about what market behavior we’re taking advantage off, and researched our signal in-depth, we have to answer our final question.
How does this apply to P&L?
Now we can run the backtest!
For this, we won’t be testing a full fledged model, we just want to analyze how different signals vary in returns.
In theory, if we got more information from the Bollinger Band signal, we should expect more returns from it right?
Ok but first, let’s start with the breakout model.
For both of these tests, I’ve assumed a flat exit at 30 days after the signal, to simulate the efficacy of the information coefficient we have from our previous tests.
What does it look like?
The risk adjusted returns are still better than just a buy and hold of BTC.
Now, assuming that our work is correct, we should see an improvement in the Bollinger Bands signal’s returns.
And here we go, it’s better on almost any risk adjusted metric.
Notice that we didn’t do any optimization to get to this better result. We merely used the market impact information that we worked on, as a guide to which signals should give us better returns on our investment.
And this is how proper research is done.
There’s much more to go into as:
Impact of beta exposures on future returns
Continuous signal vs binary signal
Benchmarks for profitable IC across different markets based on volatility
And much more that we will be exploring in future articles…
This article serves as the foundation for the research we will be doing into the future.
Now we can go from here and build models that are driven by real market behavior, that we are confident about.
I hope you’ve enjoyed today’s article!
Ps… Looking to Work With Me?
After testing 100’s of trading strategies and spending 1,000’s of hours studying trading and building my own models, I had a few clients reach out to work with me and the outcomes have been quite good so far!
I’ve helped multiple clients now:
Develop their first systematic model
Help reviewing their current trading processes
Build solid frameworks on trading system development
Stop wasting money and time on bad ideas
Develop better risk management models
And much more…
If you want my custom help on your trading business, or would like to work with me, book a free 15-minute consultation call:
And finally, I’d love your input on how I can make Trading Research Hub even more useful for you!
Disclaimer: The content and information provided by the Trading Research Hub, including all other materials, are for educational and informational purposes only and should not be considered financial advice or a recommendation to buy or sell any type of security or investment. Always conduct your own research and consult with a licensed financial professional before making any investment decisions. Trading and investing can involve significant risk of loss, and you should understand these risks before making any financial decisions.


