Research Article #47 - Multi-Timeframe Trend Following Rules
How exiting positions on a lower timeframe affect a trend model's performance?
A good farmer understands the importance of the bigger picture, before making any major decisions.
As winter melts into spring, the farmer begins planning the next seasons.
But he doesn’t rush into it.
Instead, he spends weeks observing and studying the broader environment, analyzing long-term weather forecasts, talking to fellow farmers, etc.
The success of a plantation doesn’t depend merely on when it is planted, but also on different factors, such as seasonal patterns that influence the likelihood of rain or temperature fluctuations.
This year the farmer, through careful analysis, anticipates a drought.
So he decided to plant a drought-resistant crop, that would thrive despite these conditions.
He chose a variety of wheat, that matured quickly, allowing him to harvest just before the early frost could damage it.
The farmer knew that even though the long-term trends were favorable, the success of his harvest depended on how well he managed the short-term challenges that would arise.
As the summer ended, the wheat grew tall and golden.
The early signs of autumn began to appear as the days shortened and the nights grew cooler.
The famer knew the harvest was approaching.
This time was crucial, and soon, he will find out if his planning paid off.
The farmer continued to monitor the weather closely, the long-term forecast that guided his planting, was still on his mind, but now he was more concerned with the immediate conditions, the smaller timeframe that would dictate the exact timing of his harvest.
One morning, as it is the usual habit of the farmer, he was listening to the weather report.
This time, he heard something that made him sit up straight.
The forecast predicted an unexpected cold front moving in, bringing the frost way earlier than anticipated.
Without hesitation, the farmer gathered his tools, called his workers, and went to harvest.
Any delay would mean losing a significant portion of his crop to the frost.
By the time the cold arrived, the farmer’s fields were empty and his barns were full of golden grain.
As he sits by his fireplace, feeling a deep sense of satisfaction, he knew that his vigilance during the growing season, paying attention to the smallest detail, had paid off.
How does this story about the farmer correlate with trading? And more specifically, trend-following models?
Well, imagine that you’re that farmer and you have to pick your harvest.
If you decide to analyze short-term effects, you will get a a lot of signal on a daily basis.
This signal by nature will be less accurate, and less reliable then longer-term signals. This is because longer-term signals tend to carry more information about the market.
You can decrease the frequency of the signals if you become more patient, and look at higher timeframes for a better, more refined signal.
There’s no perfect solutions, only tradeoffs, and the one we have here is that we will enter trends later, than other traders. The good side is that we avoid a lot of false signal, that is costly and hard to manage.
Another issue, which is the one we are going to explore today, is similar to the farmer’s issue with a change in the forecast
The farmer detected a conflicting report with his longer-term forecast, which made him take the decision to “exit his position”, earlier than anticipated. The market behaves in the same way.
A pandemic, a global crisis, a bankruptcy, a war, are all possible events that happen unexpectedly. Events that are extremely volatile and most times benefit from a more sensitive exit signal.
We’ve all heard the saying:
“The markets take the stairs up and the elevator down.”
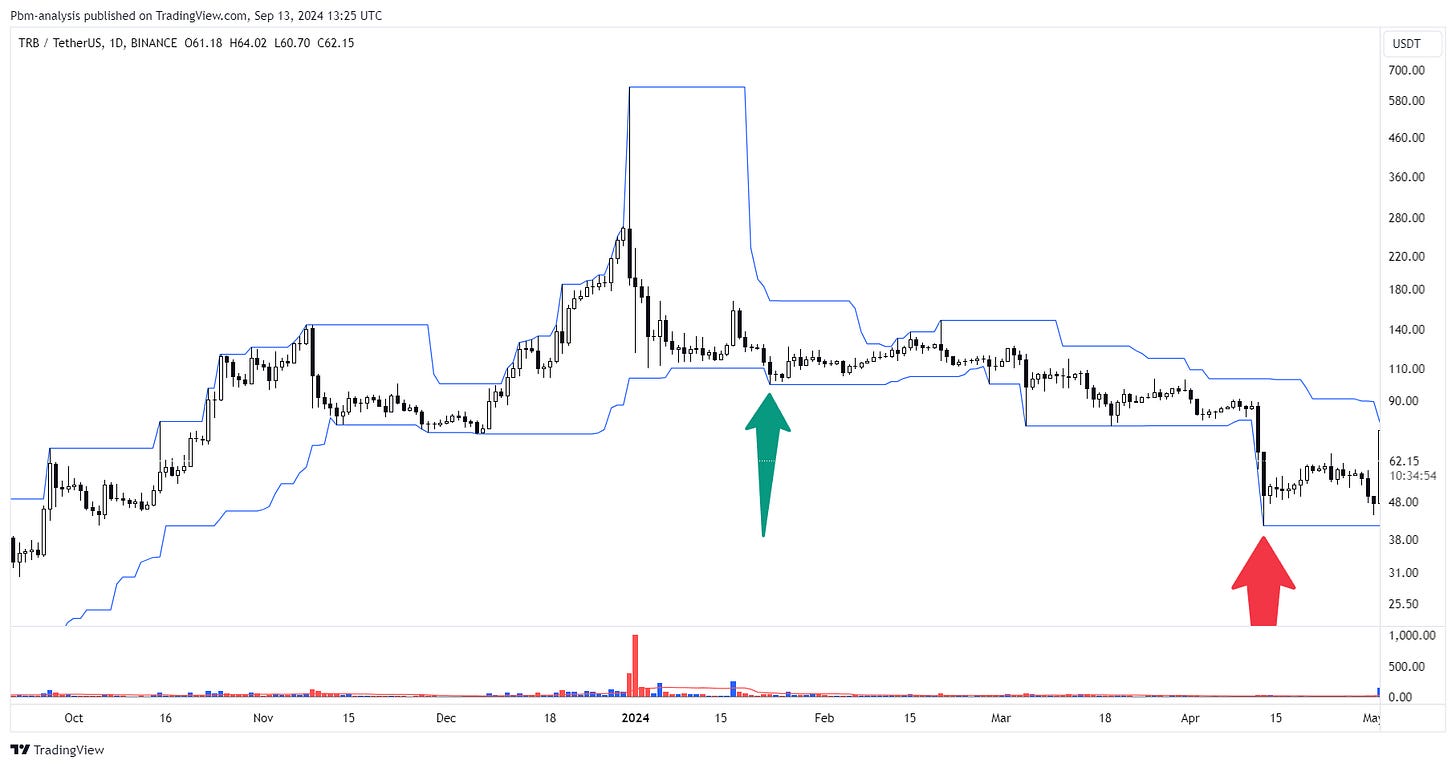
Take the example of TRB this year.
We had a massive move from the summer 2023, until early 2024.
But an exit signal with lower sensitivity, would have only allowed us to exit at 90% below the highest high in December.
Like the farmer would have lost his crop had he waited for longer-term signals of weather change, we’d also have lost our crop.
Had we used a lower timeframe, we would have exited much sooner, allowing us to keep a larger portion of our profits.
We should always be very careful about changing models based on recent information. We don’t want to insert bias in our models from recent events, we want to understand the full historical scope of the assumptions we’re making.
And that’s what we’re looking into today.
Can we be like the wise farmer and be more sensitive to short-term information?
Let’s get into it!
If you have been struggling to get results in your portfolio management business, or are not sure what direction to take to get there more efficiently, consider booking a call with me.
I also struggled for many years trying to understand all the complexity about markets. Fortunately, after 1000’s of hours of failed models and research, my portfolio has consistently been growing for many years now.
I am only available to work with individuals that either know excel extremely well, know how to code, or companies that bring their own engineering team to develop models.
If you fit these parameters and want to discuss the possibility of working with me:
Index
Strategy’s Thesis
Index
Strategy Exploration and Performance Analysis
Parameter Settings Overview
Conclusion
Python Code Section
Strategy Exploration and Performance Analysis
Let’s begin with a simple trend-following strategy and work our way towards the solution.
Below is 1 explanatory chart for each side, long and short.
Long Position Rules:


