🔍The Best Crypto Trend Signal - Research Article #49
An exploration into a single-rule trend-following system
👋 Hey there, Pedma here! Welcome to the 🔒 exclusive subscriber edition 🔒 of Trading Research Hub’s Newsletter. Each week, I release a new research article with a trading strategy, its code, and much more.
If you’re not a subscriber, here’s what you missed this past month so far:
I’ve spent hundreds of hours backtesting and optimizing strategies that look perfect.
Solid returns, low drawdowns and high sharpe.
Then I deployed them…
And lo and behold, they fall apart.
The market behaves differently than the data our model was built on, and the strategies get completely destroyed.
All that effort, while some crypto trend-follower, was producing massive returns trading breakouts or some simple mean reversion strategies.
Is it because crypto is easier?
No! It is a quite hard market to stick with, you can ask any trader there.
Above is my performance trading a trend-following model for the past year.
It’s not an easy market!!
The point is that, simplicity can often beat complexity, especially when opportunity is present.
Have you ever wondered if it’s possible to keep a strategy as simple as using only 1 rule?
Today we’re going to look into if the Bollinger band signal holds true as one of the best trend-following signals.
Let’s get into today’s article!
Index
Introduction
Index
Bollinger Bands Story
Strategy’s Thesis
Signal Quality Validation
Initial Signal Exploration
Strategy Exploration and Performance Analysis
Parameter Settings Overview
Conclusion
Python Code Section
Bollinger Bands Story
Let’s start with the story behind the indicator.
During the 1980s, there was a curious and innovative man named John Bollinger.
John had always been fascinated by the how financial markets moved, seeing them as living, breathing entities with their own rhythms and patterns.
One day, while poring over charts and data, John had a moment of inspiration. He wondered if there might be a way to visually represent the volatility of a stock or commodity, something that could give traders a quick and intuitive grasp of market conditions.
Using his knowledge of statistics, John began experimenting with moving averages and standard deviations.
After many late nights and countless cups of coffee, John finally had his eureka moment. He envisioned two bands that would expand and contract around a moving average, like the breathing of a great market beast.
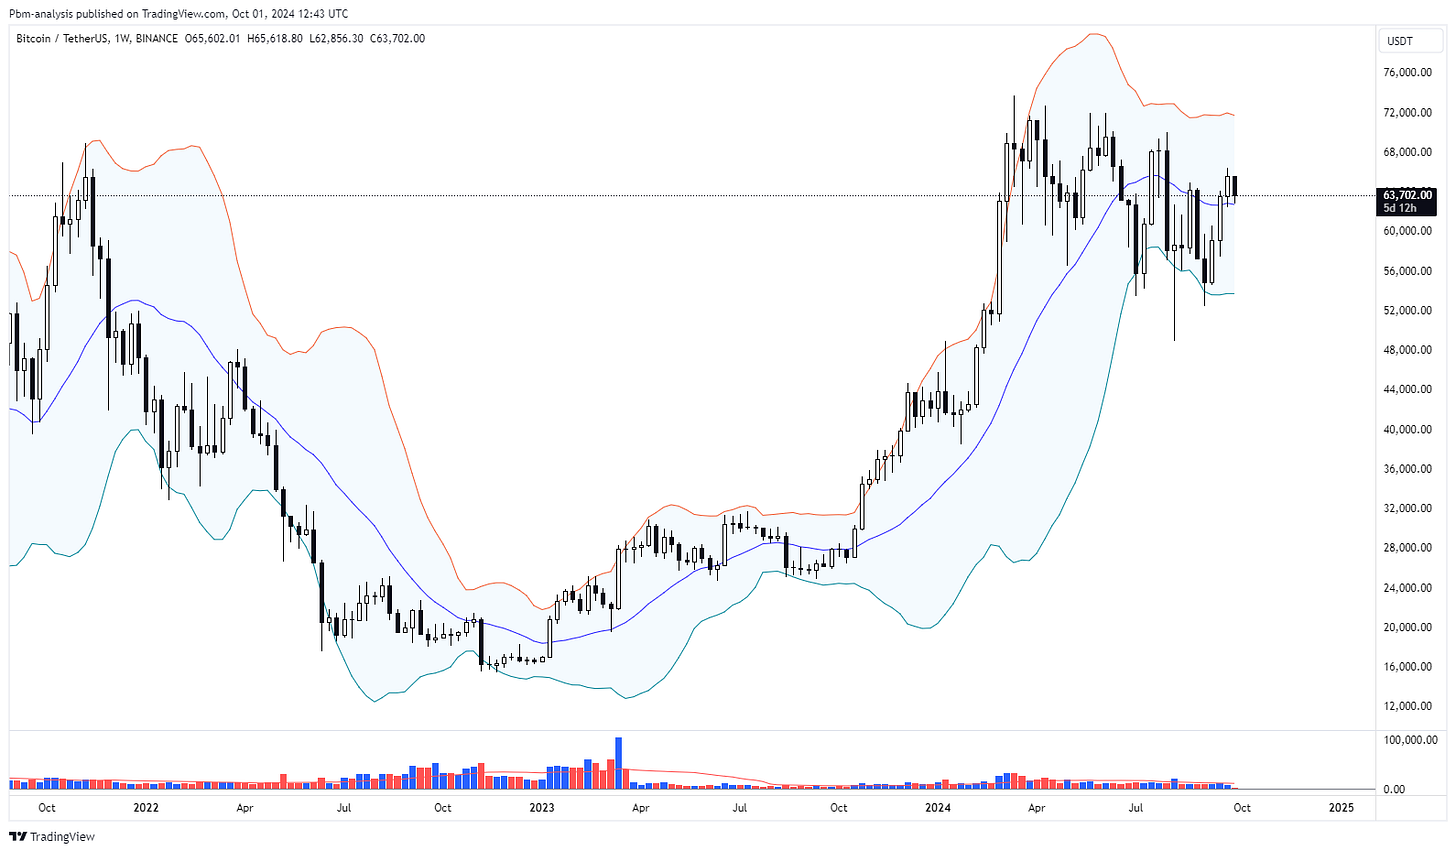
These bands would be set two standard deviations above and below the moving average, creating a channel that would contain most of the price action.
In 1983, John introduced his creation to the world, naming it after himself: Bollinger Bands®.
At first, many traditional traders were skeptical of this indicator. But as more and more people began to use it and see its benefits, Bollinger Bands gained popularity and respect in the financial community.
Today, Bollinger Bands are used by traders and analysts around the globe, a testament to John's creativity and perseverance. And so, what began as one man's quest to understand the markets better, became a tool that would change the face of technical analysis forever.
Strategy’s Thesis
The Bollinger Band trend strategy is based on a combination of both volatility and trend-following principles.
Using this indicator we aim to enter positions in periods of low volatility (when bands contract), and enter as price moves above/below these bands.
Now there’s 2 ways we can use this signal:
Trend: If we believe prices exhibit some trend behavior, we want to be buying strength or selling weakness.
Mean reversion: If we believe that prices are at extremes, we want to be selling strength or buying weakness.
Today we will focus on higher timeframe trend signals.
We want to buy when there’s a breakout above the upper band and sell when there’s a breakdown below the lower band.
One of the obvious strengths of the strategy is the clear entry and exit signal it provides. A breakout occurs when the price moves outside the upper or lower bands, suggesting that a trend might start.
Every trend starts from a breakout and this signal is a representation of that.
Signal Quality Validation
The first thing we want to check , is signal quality.


