Research Article #46 - Is the January Barometer a Reliable Indicator for Cryptocurrencies? Here's What You Need to Know
What is the impact of the effect on a trend model?
👋 Hey there, Pedma here! Welcome to the 🔒 exclusive subscriber edition 🔒 of Trading Research Hub’s Newsletter. Each week, I release a new research article with a trading strategy, its code, and much more.
Join over 5K+ readers of the newsletter!
The January Barometer is a concept that was introduced by Yale Hirsch in 1972, and suggests the performance of the market in January, predicts the market’s trend for the rest of the year.
If January is up, the remaining year tends to be up too.
But does this hold true in crypto land?
That's the question for today’s article to answer.
Now, why does this matter? If the January Barometer works for crypto, it could give us an early insight into how the rest of the year might play out.
Imagine starting the year with an early estimation about performance, for the remaining of the year.
That information could potentially be used to boost our annual performance.
There’s very interesting data related to this, that we’ll go through, but also concerns around the supposed effect.
Let’s look into it.
Index
Strategy’s Thesis
Index
Supporting Evidence for the Effect
Introductory Test
Strategy Exploration and Performance Analysis
Parameter Settings Overview
Conclusion
Python Code Section
Supporting Evidence for the Effect
In a paper written in 2006, while measuring 147 years worth of U.S. stock market data, ranging from 1857 through 2003, it was found that on average, the returns over the 11-months following a positive January, were significantly higher, than the 11-month period, following a negative January.
After that, another paper was written in 2009, and it was found that in those most recent 5 years, after 2003, the average market returns, in the 11-months following a positive January, was of 8.75%, and -13.63% when January was negative.
The period from 1857-2008, following the 100 Januarys with positive returns, the average 11-month holding period was 11.01%, and the 52 Januarys with a negative market returns, the average 11-month period market return was 2.84%.
A lot of numbers, I know. I get tired reading them.
Basically it means:
January green, year green!
Despite this very impressive data, as I was reading the paper, I noticed another interesting piece of data:
Never neglect the impact of costs! Especially when dealing with strategies that require a lot of transactions.
All of my articles have assumptions for costs. I’ve had people reach out to me to say they are high, others say they should be higher still, nonetheless, I always use a benchmark, to not provide unrealistic expectations of performance.
After all, I am an actual trader, and I have to factor costs in my models, to evaluate their TRUE operational viability.
If you have been struggling to get results in your portfolio management business, or are not sure what direction to take to get there more efficiently, consider booking a call with me.
My portfolio has consistently been growing for many years now, and instead of wasting years of research, tons of money on losing strategies, give yourself or your company the best chances to get there, and faster.
Right now I am only available to work with individuals that either know excel extremely well, know how to code, or companies that bring their own engineering team to develop models.
If you fit these parameters and want to discuss the possibility of working with me:
Introductory Test
Why does the January Barometer work?
One theory is that investor behavior in January reflects their outlook for the year. Another suggests that institutional investors make significant adjustments to their portfolios, setting the tone for the year. Other theory suggests that January effect might be the result of tax-loss harvesting in December, followed by a re-investment in January.
Maybe they all mean the same at the end of the day.
It’s always hard to say for sure, what might be the true cause of an effect. My concern is always that people tend to speculate, in the attempt of assigning meaning to things that are not real.
I am also not saying that this effect is not real, it actually has some sound ideas behind it, but not all things can be explained with a logical and theoretical approach. Some effects are just there and we got to make the assumption that they will be there going forward, and diversify.
Let’s begin with a very simple test.
If we measure the SPX, we can see that around 86% of the years where January is positive, the remaining of the year returns are also positive.
This is interesting, and in line with what we expected from the paper.
But we must also remember that in general, since 1950, 73% of the years have been positive anyways.
So this effect might just be an illusion, driven by a market that has been up-only over its history.
Another critic that is common for this effect, is that if we analyze other markets, it’s hard to find the same effect, driving those markets. Which makes it even harder to justify it’s validity.
There’s specific effects that are driven by fundamental reasons in specific asset classes, due to their nature, but still, it’s nice to see it elsewhere, in order to provide more weight to whatever we’re looking at.
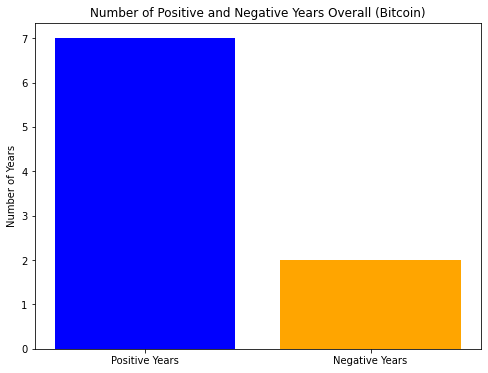
Let’s see if it’s as apparent when we look at Bitcoin.


