
Flipping the RSI Script: When 'Overbought' Actually Means 'Buy More' - Research Article #67
How a Momentum-Based RSI Signal Achieved a 1.25 Sharpe Ratio in Crypto Markets

👋 Hey there, Pedma here! Welcome to the 🔒 exclusive subscriber edition 🔒 of Trading Research Hub’s Newsletter. Each week, I release a new research article with a trading strategy, its code, and much more.
If you’re not a subscriber, here’s what you missed this past month so far:


If you’re not yet a part of our community, subscribe to stay updated with these more of these posts, and to access all our content.
A lot of “traders” have misguided beliefs about indicators and how to use the information that is derived from them.
I always come back to this quote by Agustin:
“Trading is the wrong term for what trading is. Trading is more accurately called positioning.”

When we think about a signal, many times derived from an indicator, we must think about what kind of information it gives us, and how we can use it to position ourselves.
Take the example of the RSI.
How many traders take it as a mean reversion signal with oversimplified ideas such as:
When it crosses above 70 it means a sell
When it crosses below 30 it means a buy
There was a time, long ago, where I thought that too. It’s normal when we don’t test these assumptions.
But does it make any sense, in a market and frequency that is highly driven by momentum/trend properties, to be trading mean reversion signals? Why would a simple indicator, trading against its broader long-term trend, make any sense?
If we do a simple predictive test of the indicator, we can see that no, the opposite actually predicts returns much better.

I’ve tested a bunch of variations of this indicator to make the point that stronger RSI indicates higher potential for future returns.
Here’s an equity curve, from today’s research article, testing a simple binary RSI signal, but doing the opposite of what’s the “normal belief”.

With a simple approach, like I’ll describe below, the model achieved much higher risk adjusted returns than the benchmarks.
Bitcoin Sharpe: 0.94
Altcoins Benchmark Sharpe: 0.87
Strategy Sharpe: 1.25
The strategy not only works on the long-side, but also on the short-side. This means that we can trade different regimes, with the same underlying signal.
The full access to the rules of this model is within this article.
(This article is for informational purposes only and contains hypothetical data. Past performance does not guarantee future results.)
Index
Introduction
Strategy Thesis
Data and Methodology
Performance Analysis
Conclusion
Strategy Thesis
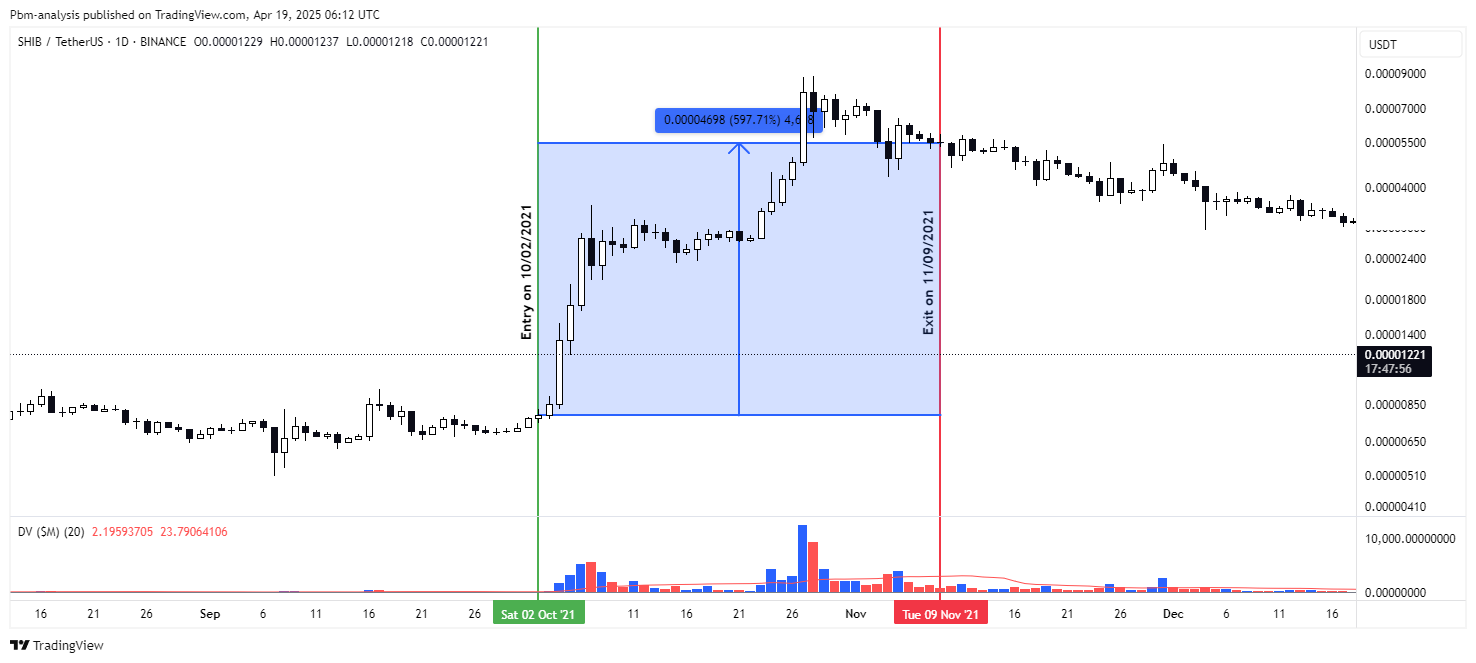
Here’s an example of one of the best trades caught by the chosen iteration of today’s model. We entered this position on the 2nd of October 2021 at $0.00000786, and exited on the 9th of November 2021 at $0.00005484, giving us close to 600% gain on a single trade. We didn’t get the absolute top tick, but we did get the bulk of the trend, which is the purpose of this systematic strategy.
If you’re interested in 1-1 consulting with me, I am opening a few spots this year to help traders develop their own portfolio of systematic trading strategies. If you’re interested, book a free call and ask me any questions: https://cal.com/pedma/15min