Strategy Backtest #14
Filtering the Momentum: Unveiling Strategies Through Backtested Waters
Note: It's crucial to acknowledge that the performance of these strategies may vary in future scenarios. I employ backtesting to assess the past performance of different strategies. However, it's important to note that backtesting relies on historical data, not live data, making the outcomes discussed speculative rather than actual. There's no assurance that such performance will persist moving forward. Engaging in trading carries a high level of risk. Should you venture into live trading, brace yourself for the possibility of a total account loss.
Introduction
The goal of these series is to make your life easier and to get all backtests of current strategies under one place that you can speed up your research. Not everyone can commit several hours a day to pure research so I want to fill that “gap” in the market and share with you all the research that I find on my daily research.
Finding trading strategies is all about research and networking in my opinion. If you lack ideas you need to start reading and working with people in the field that know what they’re doing and that actually have live proof record of consistency.
Today we will be testing this Strategy Idea .
Strategy Parameters
The author of the strategy mentions the following rules:
Entry Price: 21 day breakout
Trailing Stop: 21 day trailing stop or loss of momentum
Position Size: 10 (positions) at 10% allocation each
Ranking Metric: Lowest historical volatility
If you notice there’s two variables that are not very well defined:
“Loss of momentum”
“Lowest historical volatility”
It is common that authors don’t share all the details of their strategies and even some don’t mention them at all, especially on low capacity strategies. If you have a winning strategy, what’s your incentive to share the absolute best version of it?
In these cases we will have to define them ourselves.
Structure for the Code
In order to build the code we must first design what we want to achieve. We need to understand the universe of assets we’ll be trading, how we rank them amongst other tradable assets and how do we manage open exposure.
These are all complex tasks, so let’s start by first defining each:
Asset Selection: All spot assets available at Binance
Timeframe Selection: Daily timeframe
Portfolio size: $100K
Data Extraction: Extract data for every asset available from the asset selection for the chose timeframe
Ranking Selection: The author mentions lowest historical volatility. To keep it simple lets use a simple standard deviation of daily returns. The ones with the lowest, are the ones that are ranked higher.
Rebalancing: The author also doesn’t mention any rebalancing so we will assume that we hold the position to close without any open exposure adjustment.
Calculating Trades:
Open a position for the top 10 assets that break their 21-day high
Track open exposure to understand if we can open more trades
Exit positions on either:
21-day low breakdown
Loss of momentum: Since the author didn’t define this, let’s say that momentum is lost when the ROC (rate of change) is below 0.
Observations from the unfiltered results
expected from an extremely hard market in 2022, the majority of altcoins are not good for swing trades. Most of them have very few days of “strong” performance and then quickly fade to where they come from.
We need to build some sort of filter that can filter out weak performers from the universe of assets to trade and only trade those that are strong even within a “bearish” regime.
Adding a filter to smooth out returns
In order to test for filters that could make sense, we need to understand what it is that we are taking advantage off in the market. If we don’t know what kind of property is our strategy built on, we don’t know how to add a new layer of filter.
If we are buying assets that are breaking out of their 21-day high, we are making the assumption that a breakout will lead to further advances in price. We can assume that what we’re doing is about momentum and trend. If we expect momentum, it does seem to make logical sense that we buy the strongest assets within the universe of assets we chose. Let’s test that theory by applying the following filter:
In addition to the other entry rules, we only buy the asset if they are within 25% of its maximum high
This way we will ensure that we are only buying assets that are close to making new highs. Let’s see the changes in performance after adding this filter
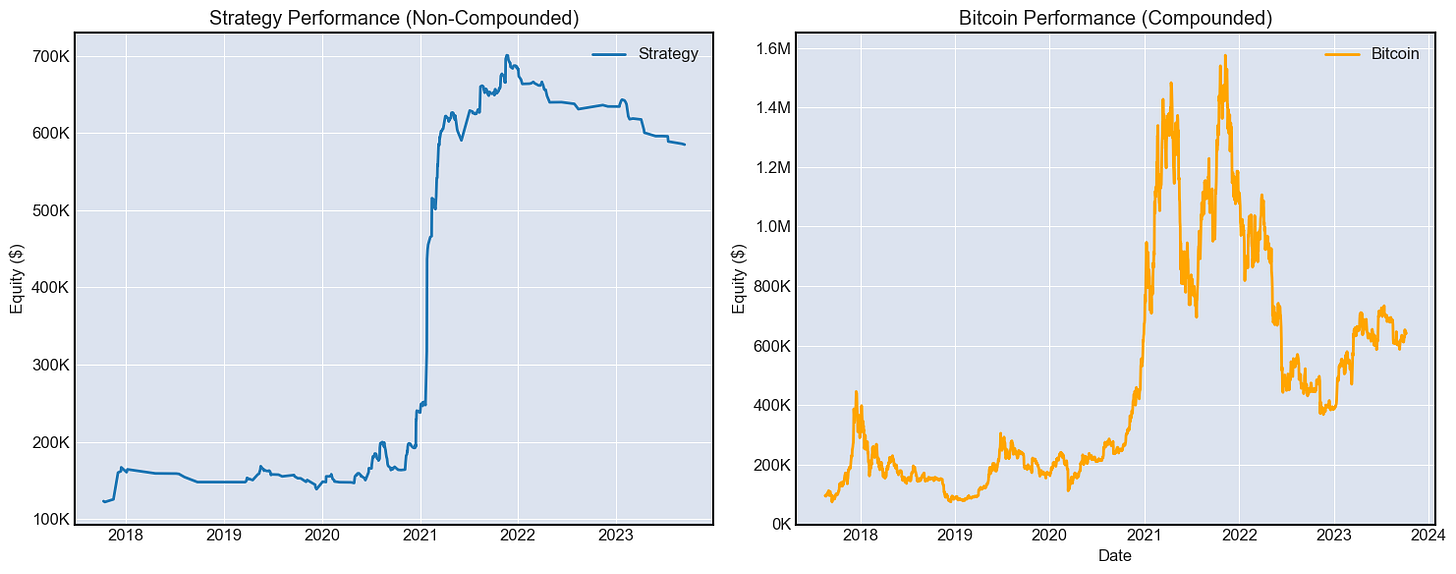
As we can see the performance changes dramatically. We no longer give back most of the returns because we are not buying coins that are on a directionally weak trend. Which makes us conserve more capital.
The risk adjusted returns improve massively compared to the previous unfiltered test jumping our sharpe ratio to 0.15 from 0.01. Also we keep a lot more of our returns made in previous cycles by employing the filter.
The best trade for this strategy was $MATIC:
Conclusion and final remarks
I hope you've enjoyed this simple test of a momentum strategy. These momentum systems are more about how you manage drawdowns than the actual complexity of the signals. Yes, you can squeeze more percentage of trends, but the biggest impact on the bottom line of your strategy will be in how you deal with weak and choppy environments. It's all rainbows and sunflowers in a backtest, but going through deep drawdowns over large periods of time will definitely affect your life if you let it. So, focus on managing periods of poor performance.
I will keep producing these tests going forward, and they will improve and grow more useful as time goes on.


Hi!
Thank you for the strategy. Do you have a python code for this, that you don't mind to share?
Thank you!