Strategy #16: Cryptocurrency Pairs Trading and Statistical Arbitrage
Dissecting the mechanism, challenges, and implications of this promising approach on top cryptocurrency pairs.
Introduction
The cryptocurrency landscape, with its rapid shifts and monumental returns, offers traders both promises and puzzles. Among these is the intriguing Strategy #16: Pairs Trading or Statistical Arbitrage. This piece offers a comprehensive breakdown of its application on top cryptocurrency pairs, guiding traders through its potential highs and lows.
Getting the Data Ready
Data Selection
The foundation of any strategy lies in the integrity of its data. For this exploration, we've turned to Binance, a reputable source that provides data and we chose the top 23 by market capitalization. While the daily data offers a bird's-eye view, exploring alternate timeframes could provide granularity, adding layers to our strategic depth.
The Costs of High Frequency
But it's not all smooth sailing. With increased data granularity comes higher trade frequency, and subsequently, steeper costs. The 23 coins under our lens give rise to an extensive 253 potential coin combinations. As this number balloons, the computational intricacies could become a strategist's nightmare.
Setting the Groundwork
Normalizing Prices
Price data, raw and unprocessed, can be like comparing apples to oranges. Enter normalization – our tool to level the playing field. By dividing every price point by its initial value, we can observe relative asset performance, tracking how they evolve over time compared to their starting point.
Unpacking SSD and its Significance
SSD, or "Sum of Squared Differences," isn’t just a fancy term. It’s the heartbeat of our strategy. It quantifies the divergence between two data sets. For this strategy, we're using it to measure how two time series (in this case, asset prices) move relative to each other. By examining these values during our "formation period", we get a historical perspective on asset behavior. But history is no soothsayer; previous trends don't necessarily predict future movements.
Crafting the Trading Strategy
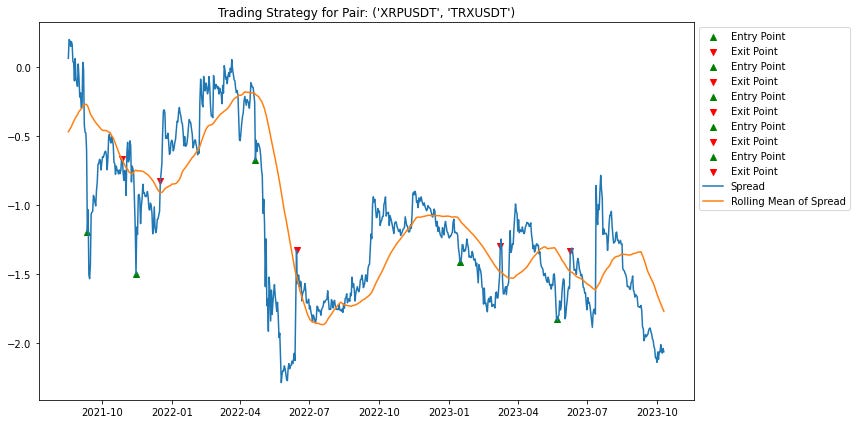
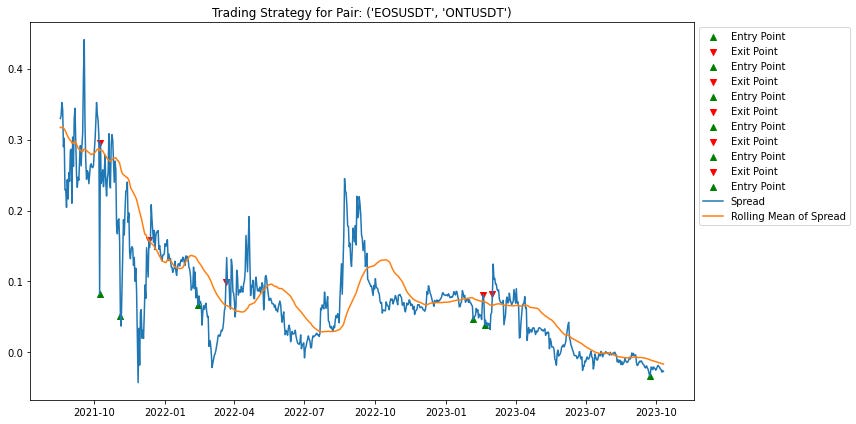
Crafting a strategy isn't just about number crunching; it's about weaving those numbers into actionable insights. Our Z-score calculation, using the asset spread, is the loom for this process. Signals are born from this Z-score, directing when to make long trades.
Sample Trades: The Proof in the Pudding
They say the proof of the pudding is in the eating. So, to showcase our strategy in action, here’s a taste:
EOSUSDT/ONTUSDT
XRPUSDT/TRXUSDT
ONTUSDT/NULUSDT
ICSUSDT/ZRXUSDT
This platter only serves four of our ten selected pair delicacies, but it gives you a flavor of our approach.
Navigating Potential Pitfalls
Like any strategy, this one also has its bumps and bends.
The Missing Stop Loss: Not having a stop loss is like sailing without an anchor. Our current model lacks this, leading to potential volatile swings, especially if assets start dancing to different tunes and lose their correlation.
The Assumption Trap: A static mindset in a dynamic market is a recipe for disaster. Believing correlations won't shift post-formation is a precarious assumption. Markets, with their fluidity, often rewrite their own scripts, requiring traders to adapt and evolve.
Concluding Thoughts
As we wrap up this exploration, here are some strategic highlights:
Our worst hiccup was with the Pair: ('IOTAUSDT', 'XLMUSDT') on 2022-04-11.
Conversely, our shining moment was with the Pair: ('LTCUSDT', 'XLMUSDT') on 2022-03-31.
Through the twists and turns of this analytical journey, my hope is that traders can glean insights to enrich their strategies. While this exploration is freely shared, the effort and cognition behind it are high. Maybe, in time, I'll delve even deeper. Until then, trade wisely!


