Seasonal Shifts in Crypto: From September's Silence to Q4's Rally
Understanding Yearly Trends and Their Impact on the Cryptocurrency Landscape
Hey everyone!
First and foremost I’d like to apologize for my lack of activity here on substack. It’s been a hard task to reconcile trading, projects, writing on twitter and substack. So I took a pause from writing here but I am aiming to get back and write at least once a week about markets and the current state of the market.
So let’s get into today’s article.
September Seasonality
September has a tendency to be the weakest month in crypto. Below is the chart of the average daily returns for every year since 2011 on the month of September.
You can see that it’s an average down month with very little strength. If we compare it this year’s September, we can actually spot some unusual strength mid of the month, above the average expected for the month.
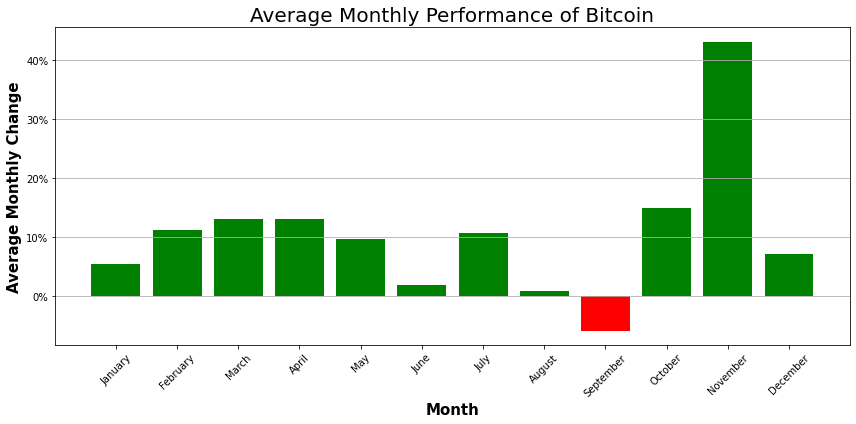
Looking at the full picture of all months in the year, we can see that September is really that month that the market is weakest on average.
These are averages, some years September can even be positive, the point is trying to spot seasonal patterns that are more likely to occur. Also if we can give some sort of explanation for it, even if wrong, it adds to the conviction.
We know that Augusts and Septembers are weak in general. Why? People are usually on vacations around these times and markets are generally slower. So it makes logical sense that we shouldn’t expect strength when the majority of the market are on holidays and the other minority is distracted.
Going into Q4
On average, looking at the performance data, we can see that Q4’s tend to be stronger. This is equally true in equities.
Performance could be skewed by a few large months but if we look at the performance of each Q4 for each year, we can see that it is in fact a strong period. And when there’s weak periods, they don’t compare to the stronger ones.
For the past 2 years (2021-2022) we’ve had slower Q4’s compared to historical terms. Having 2 weak Q4’s in a row don’t happen that often and are usually followed by a strong third year Q4. Obviously this is very small sample, we only have 11 years to compare. But the point is to look at these stats from an interesting point of view, not as a trading point of view.
I don’t trade based on these statistics, they are more informative that we could see stronger action heading into years end and so I am more alert and making sure that my shop is set up efficiently enough to fully capture any opportunities that may arise. It doesn’t mean that I am buying Bitcoin because Q4’s are strong, I don’t do that type of trading.
First-half Growth
There’s another seasonal metric that we look at , and that is the first semester of the year. If the first semester is positive, does it correlate to a positive second-half of the year?
If we look at the chart above, you can see that only in 2019 we had a positive first-half of the year, and then the second half was negative. The first half of 2023 was positive, now all is left to do is waiting and see what happens by the end of the year.


