Research Article #40 - Larry William's Volatility Expansion Strategy
Testing and improving a momentum volatility expansion strategy
👋 Hey, Pedma here! Welcome to this month’s ✨ free edition ✨ of Trading Research Hub’s Newsletter. Each week, I release a new research article with trading strategies, code, and much more.
Join over 5K+ readers of the newsletter!
Hey everyone,
I hope you’re all having a fantastic week!
It’s 01:09am Portugal time, I haven’t eaten lunch or dinner today yet, just to finish writing this article. I’ve just finished it, and I got to say, I think it’s pretty good. I’ve been writing and thinking about this one since Monday. I’ve changed and added a lot of depth to it, which I am very happy about.
When I began writing this newsletter, earlier this year, I thought that readers wanted shorter articles, straight to the point. But as I’ve been getting more reviews and feedback, it does seem that a lot of you do enjoy depth and analysis. So I’ve taken your suggestions, and we’ve made major upgrades to how our articles are written.
To showcase the work we’re doing, today’s article will be available also to free subscribers, except the Python Code Section. Unfortunately the code section just takes us too much time to give away for free, and I reserve that section to our paid subscribers!
I won’t be releasing many of the Research Articles Series for free, as it takes me at least 6h-12h to produce (this one took a lot longer). So if you want to join us, and continue to expand your book of trading strategies, feel free to do it here:
I was thinking of what kind of trading strategy to publish this week. I already had an entire strategy set up, code ready, performance review ready, and a big chunk of the article.
But after reviewing it, I was not happy about it. So I deleted it, and started fresh. When I feel good about an article, I know it’s a good one, and that people will enjoy. But when I have the slight feeling of “mehhh” , I don’t do it. I don’t care if I have to re-write it from scratch. I am here to deliver my best work. And if that’s not my best work, then I don’t send it.
That is one of the reasons that sometimes, some articles, do take longer to be sent out. It’s not as linear as finding a strategy, testing and sending it. I could send you terrible ideas, like other newsletters do, with data mined strategies that look great on paper, but have no shot of working out once deployed. But that’s not what I’m about.
I prefer to just delete all the work I had done prior, and start fresh with a new idea.
Today’s strategy is based on Larry William’s book, Long-Term Secrets to Short-Term Trading.
He published this idea about volatility expansions, and how he has been using the method for over 20 years since he discovered it. The book was written in 2011, so we have close to 13 years of out of sample performance to verify if it’s still performing or not.
Let’s get into it!
TLDR Summary
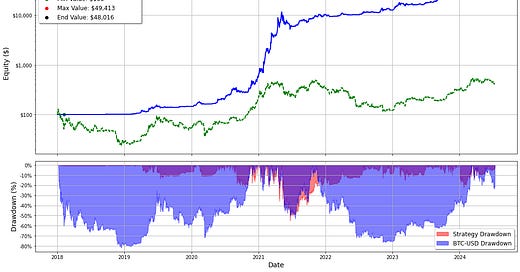
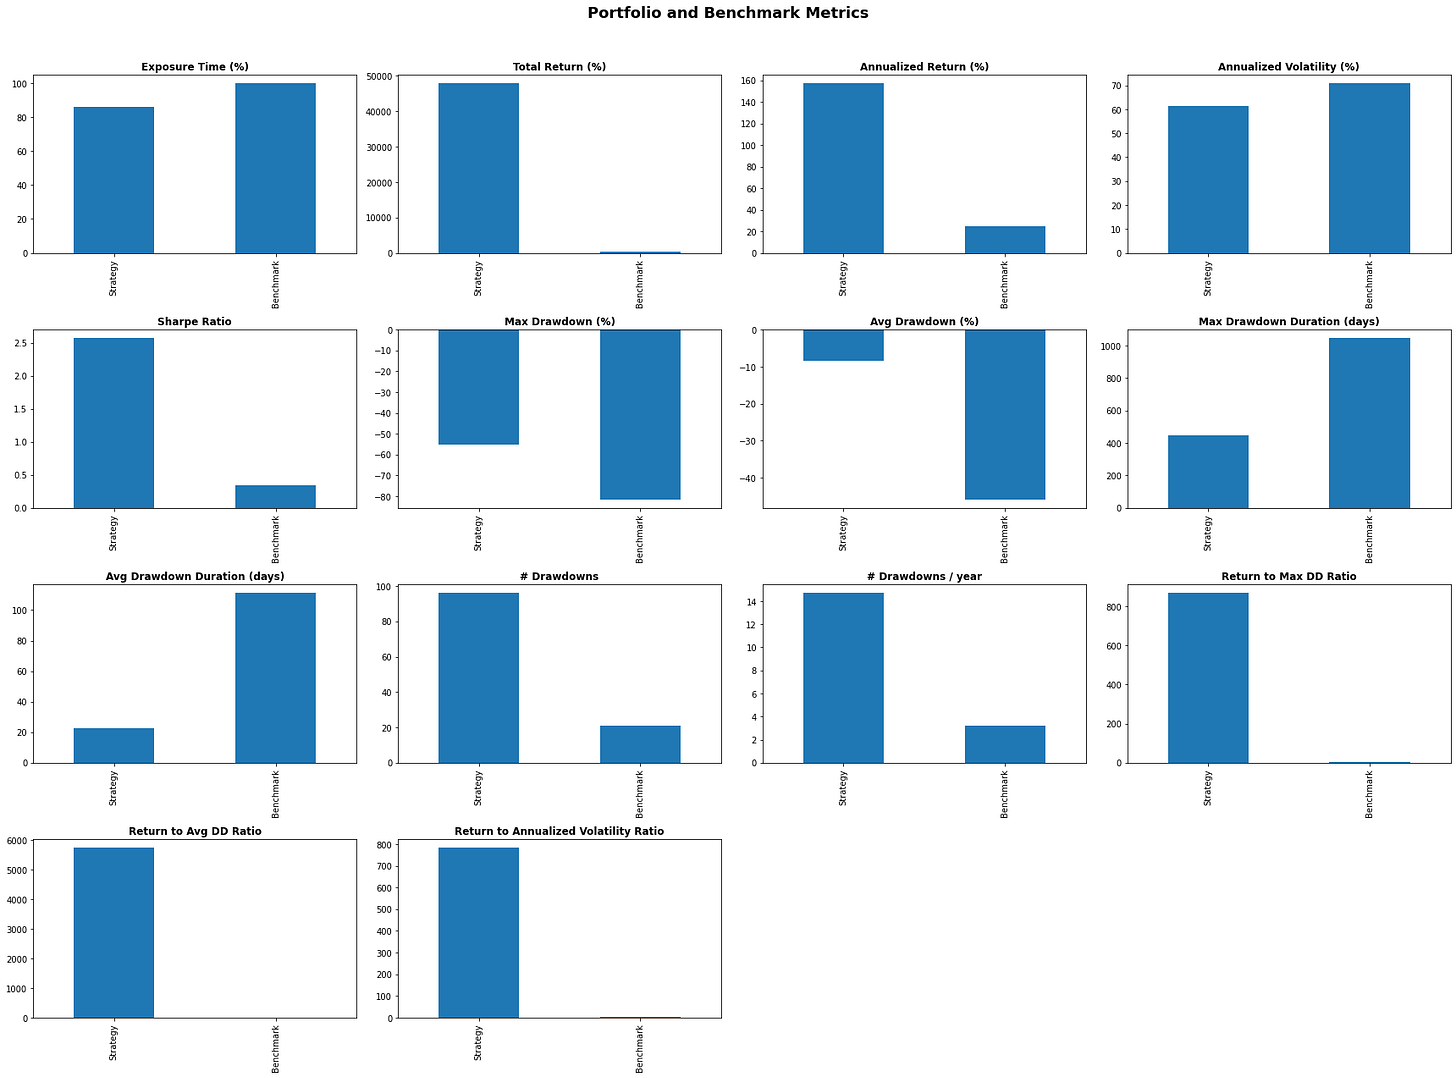
Crypto performance:
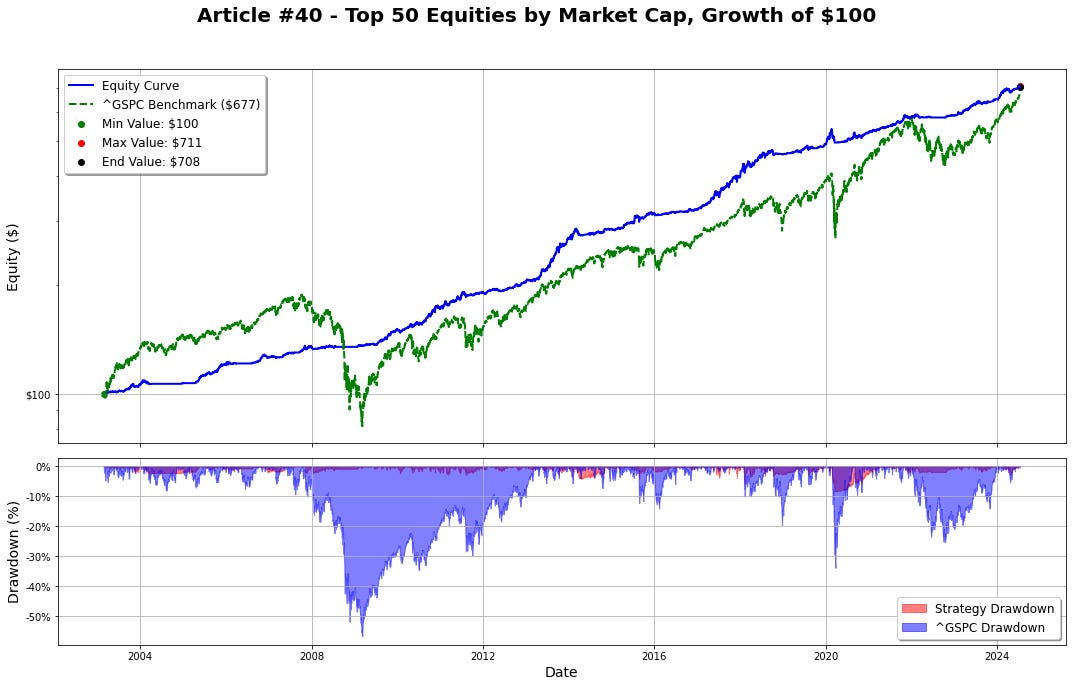
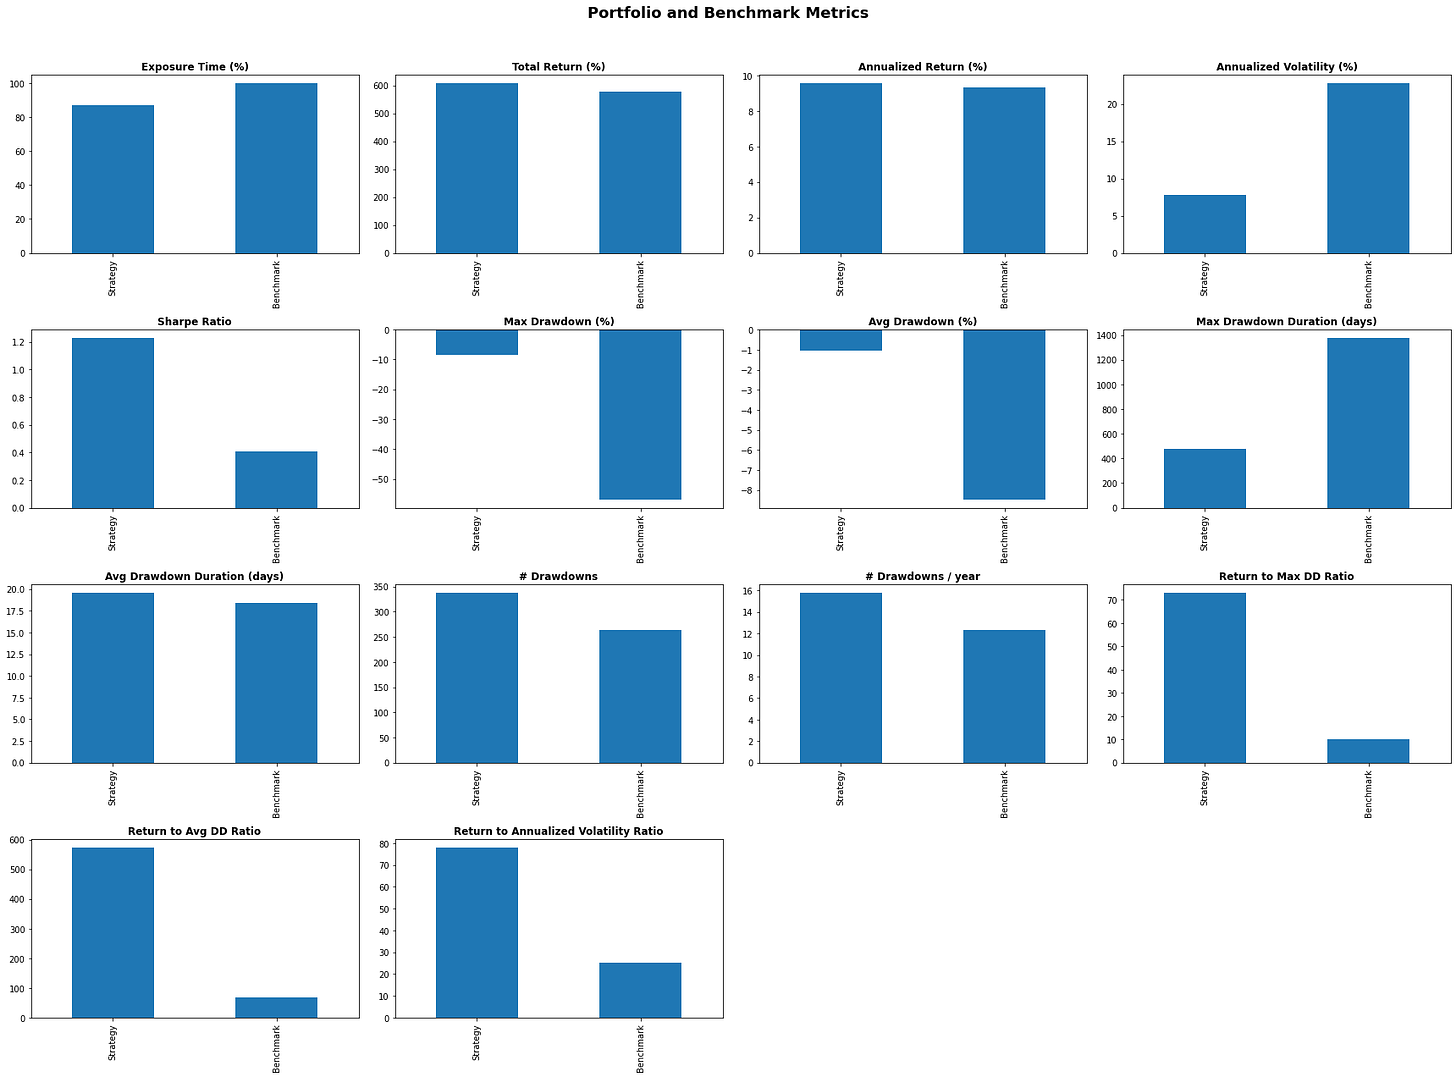
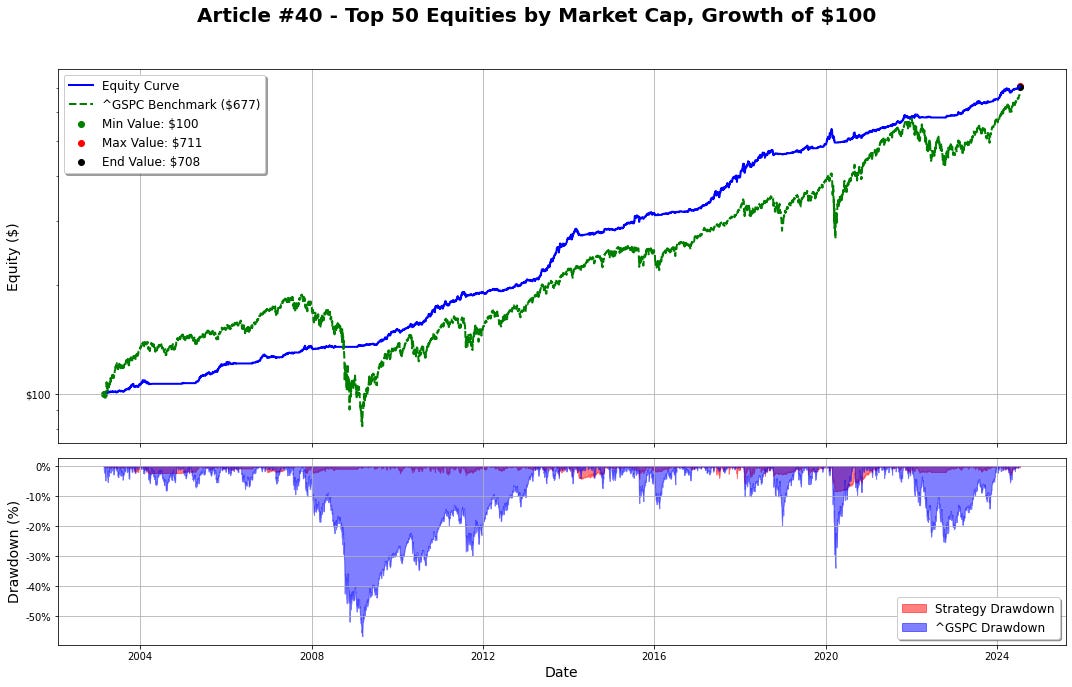
Equities performance:
If you want to learn about the rules that drove these returns, the entire code, and more, keep reading! 👇
Index
Introduction
TLDR Summary
Index
Strategy’s Thesis
Diving into the Data (Optimization)
Parameter Settings Overview
Long-Only Model Performance Analysis - Conservative Risk Tolerance
Edge Effect in U.S. Equities
Conclusion
Python Code Section
Strategy’s Thesis
When we are evaluating an idea for a trading strategy, we must always think about what it is that is driving the returns. The returns are not driven by our rules. They are driven by unique features, that we call factors, that are present in markets. Rules are mere tools that we use to extract these returns from the market. Momentum is the core principle that drives the returns of this model. Momentum can be simply explained by Newton's first law of motion: "An object in motion, tends to stay in motion."
The same principle can be observed in stocks, commodities, crypto, and other markets returns. Once price starts to move, it is a good bet to make, on the assumption that it will keep moving on that direction. If the broad market is strong, this effect is even more pronounced. Even though it can be argued that the influence of beta should be removed from the analysis, we are not here to be overly complex.
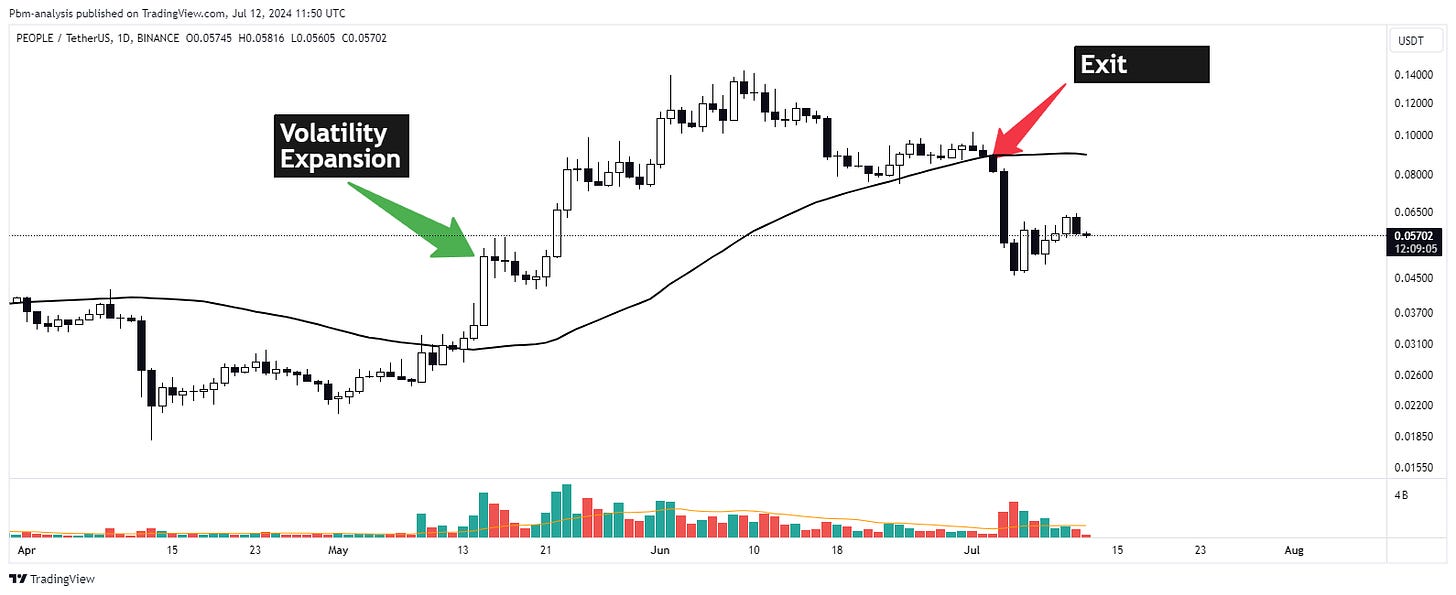
As I was reading Larry’s book, he mentioned that this approach, is one of the best ones he has found to work in the markets. He says that “Trends are set in motion by what I call explosions of price activity”.
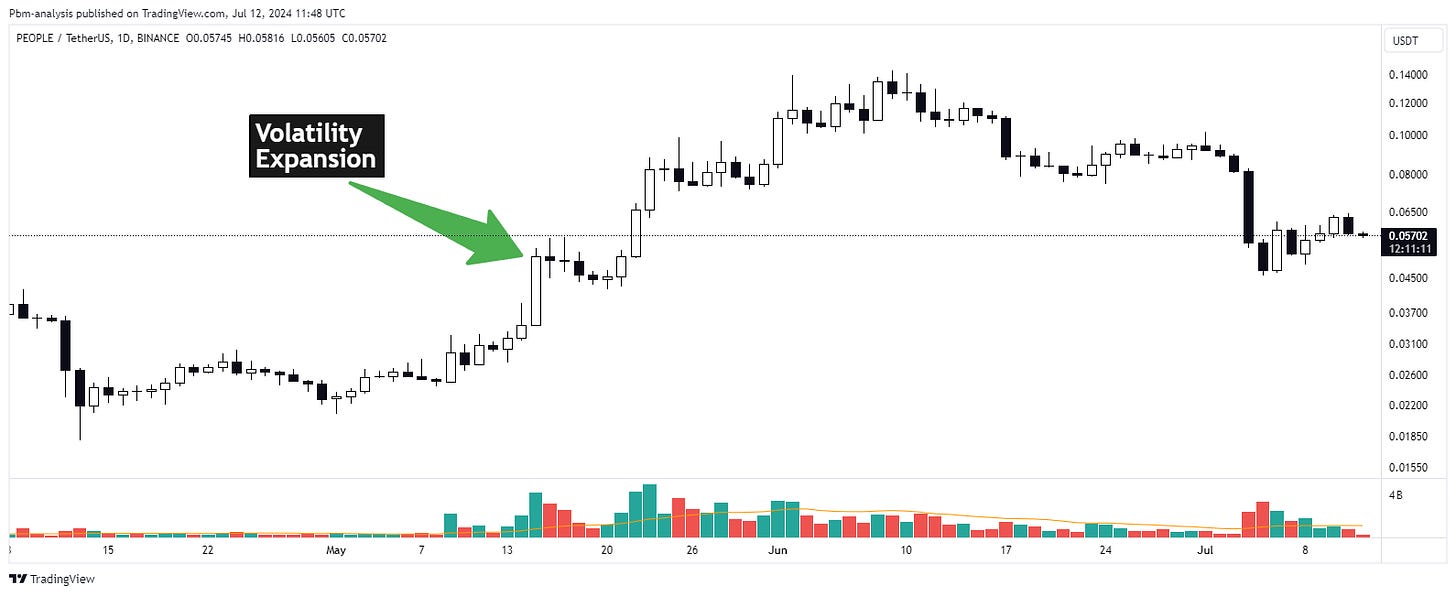
If price in a given timeframe has an explosion in volatility, up or down, the market will continue to trend in that direction, until there’s an equal opposite force.
This makes sense. People like to trade high volatility assets, and also bet on the direction in which those massive gainers picked up.
Let’s think it from a pure behavior psychology point of view.
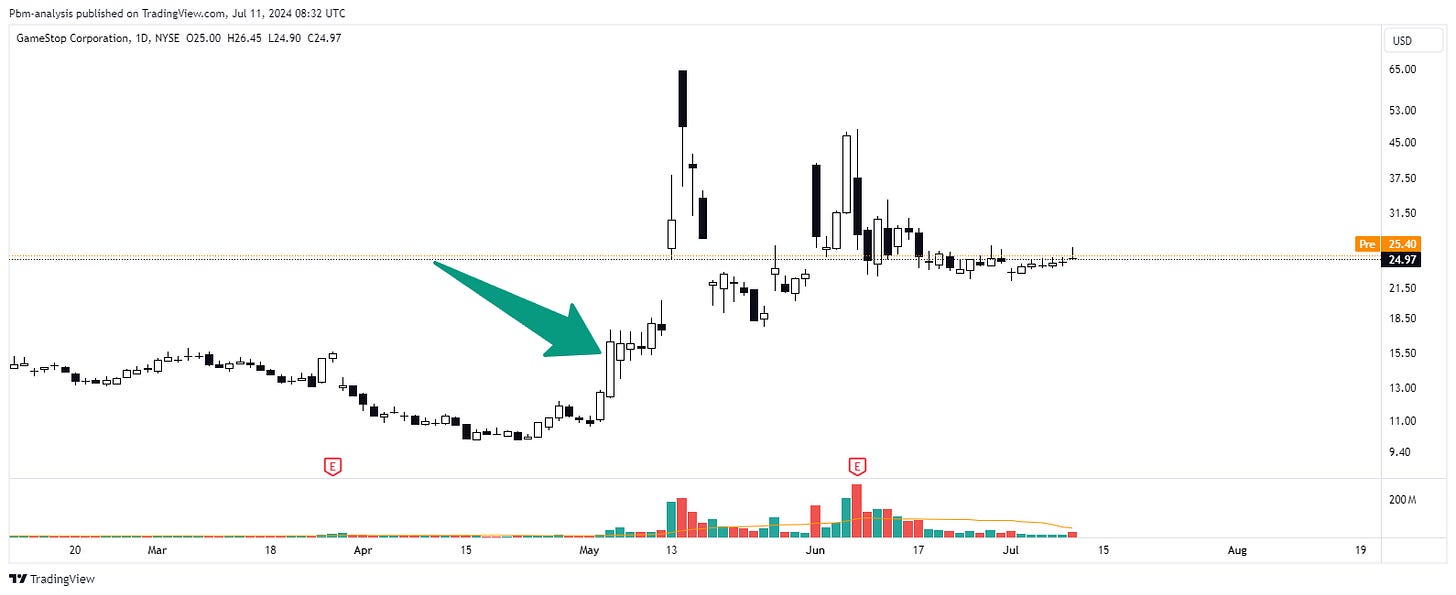
An asset like $GME (GameStop), had a burst in volatility from average behavior. You know that this stock is a potential outlier, given it’s history with the public. If you are into active trading, it’s normal that you will feel the need to place a bet, even if that bet doesn’t play out. This behavior in mass, makes assets move and produce short and long term trends.
Now the reverse.
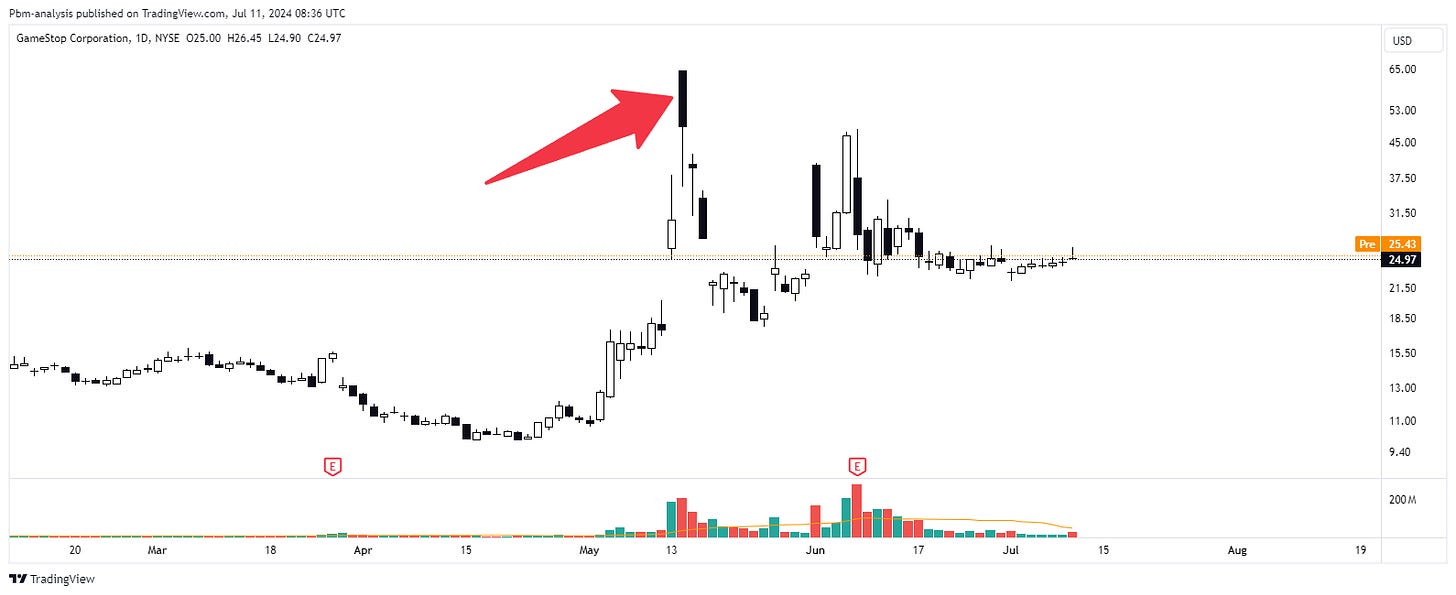
When the stock had a massive burst in volatility, and closed red on the day, that’s an indication of a shift in the demand of the stock. Now, not only did buyers not been able to push the asset further, they are no longer able to hold it, at those prices. Market participants watch their gains become smaller or evaporate, and they want a way out. This behavior is what starts short or long term reversals.
This is the basic concept behind momentum. Some people don’t agree that a pure behavioral explanation is enough, but for me it’s enough. We know that people drive markets, and we know how people operate when greed and fear are on the table.
But how to trade this phenomenon? Let’s see what Larry writes about the strategy.
“From the preceding we have learned that we should add our breakout value to tomorrow's opening. Now the questions begin; What's the best value?. There are several good ones, but the simplest is to take today's range adding a portion of it to tomorrow's opening. Just that simple approach has been a consistent moneymaker since I first discovered it almost 20 years ago.”
“A protective stop of $1,500, or 50 percent of the previous day's range, subtracted from our entry, is used as our protective stop, while our exit is the Bail Out, or the first profitable opening after entry technique. “
Page 61-62
He goes on about using specific days of the week to trade the signals, but I don’t believe in the robustness of those ideas, so we’ll keep it to the first iteration of the model.
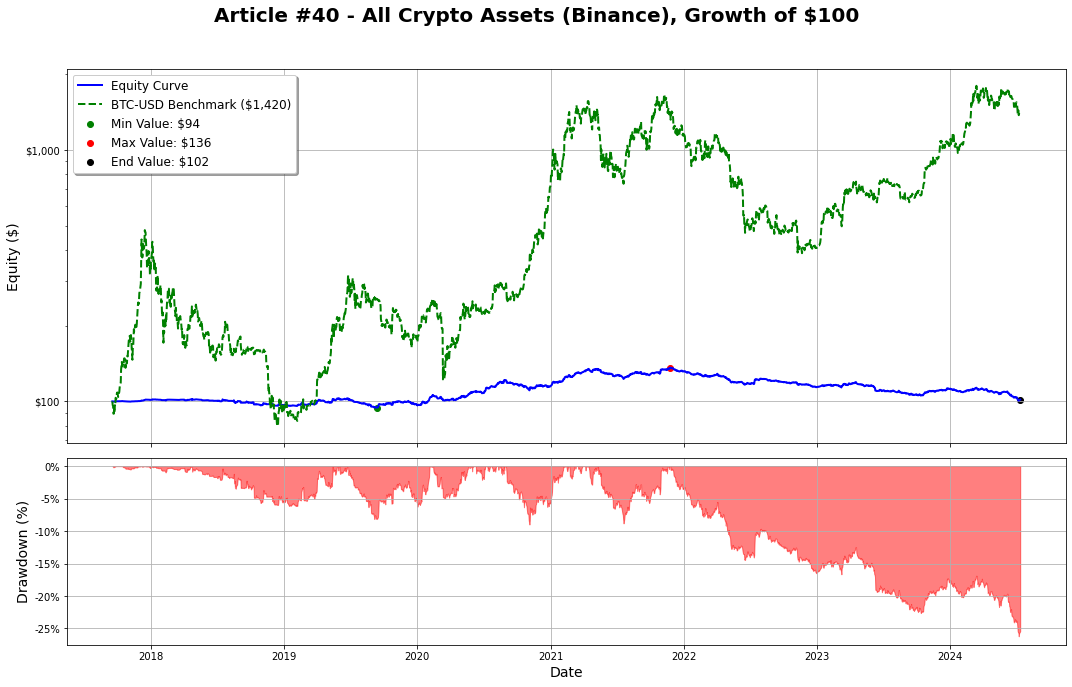
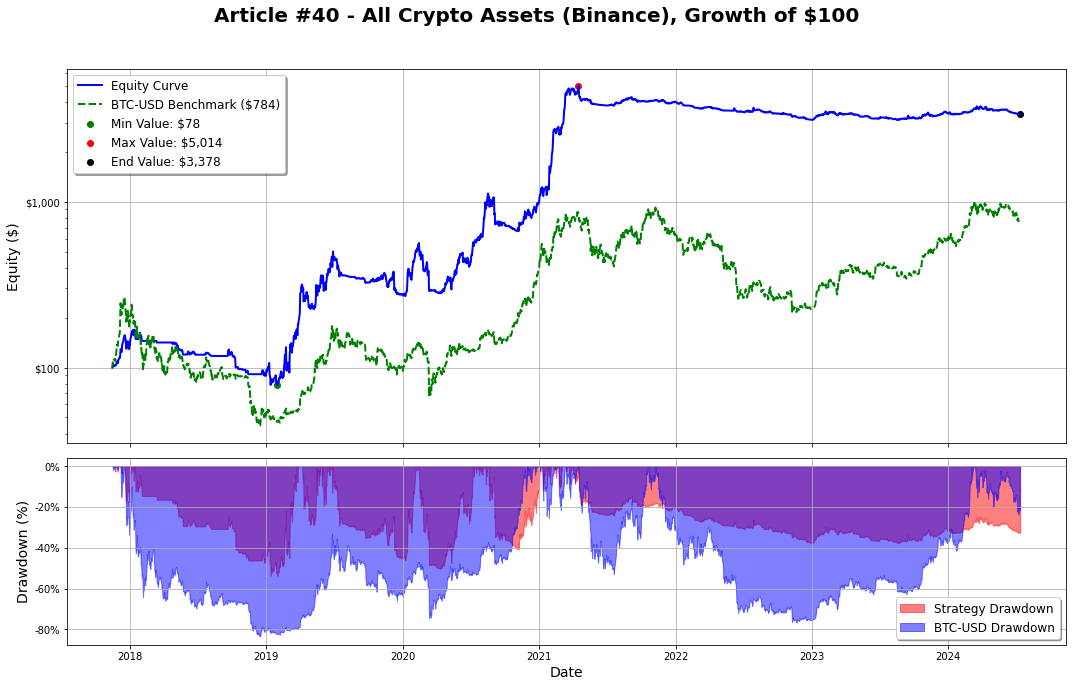
Here’s the results for the first iteration applied to crypto:
It looks really bad.
I might be interpreting his strategy the wrong way, or adding too much costs, but the reality is that it doesn’t work well. I’ve only allowed 15 positions at any given time in the portfolio, with a target volatility of 20%. It massively underperformed BTC’s returns and almost closed below the initial portfolio value, after 6+ years in the market.
A big problem with a lot of books on trading strategies, is that they do not fully representing the total cost of trading.
If we ran the same model, but without factoring in fees and slippage, sure it looks a lot better, as one would expect. But that is not realistic for a practitioner of the game. We will pay fees, commissions, incur in slippage, have delays in execution, and the list of inefficiencies just pile on and on. So we need to account for these, and give margin for the unexpected.
Ok but we don’t give up.
We still have here an interesting momentum signal, and let’s find out if other variations of rules can help with the returns.
Diving into the Data (Optimization)
I don’t like to play around too much with rules, but if we’re going to look for a better approach then we had before, we need to first start somewhere. Let’s begin by thinking through the problem. What are we trying to be exposed to, when we enter a position on a volatility expansion?
To the directionality that could follow that expansion, right?
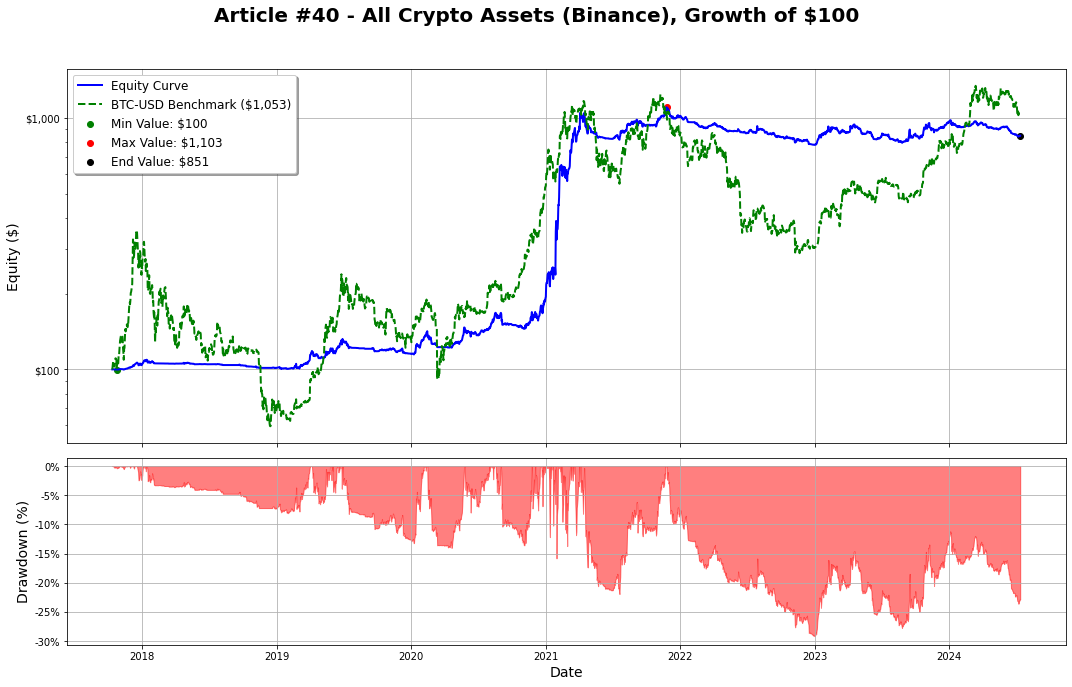
If we start to form an hypothesis about a factor that is derived from price, it’s good to try and take some observations from that underlying data source. So let’s begin with a simple test. We want to see how does our model react, if we add a negative momentum signal, as an exit, as opposed to the initial rules. Let’s begin with a simple close below the 50SMA.
Now we start to have something that looks more interesting. Although we haven’t made much money since 2021, which is weird. But the work continues. We have to keep digging (carefully).
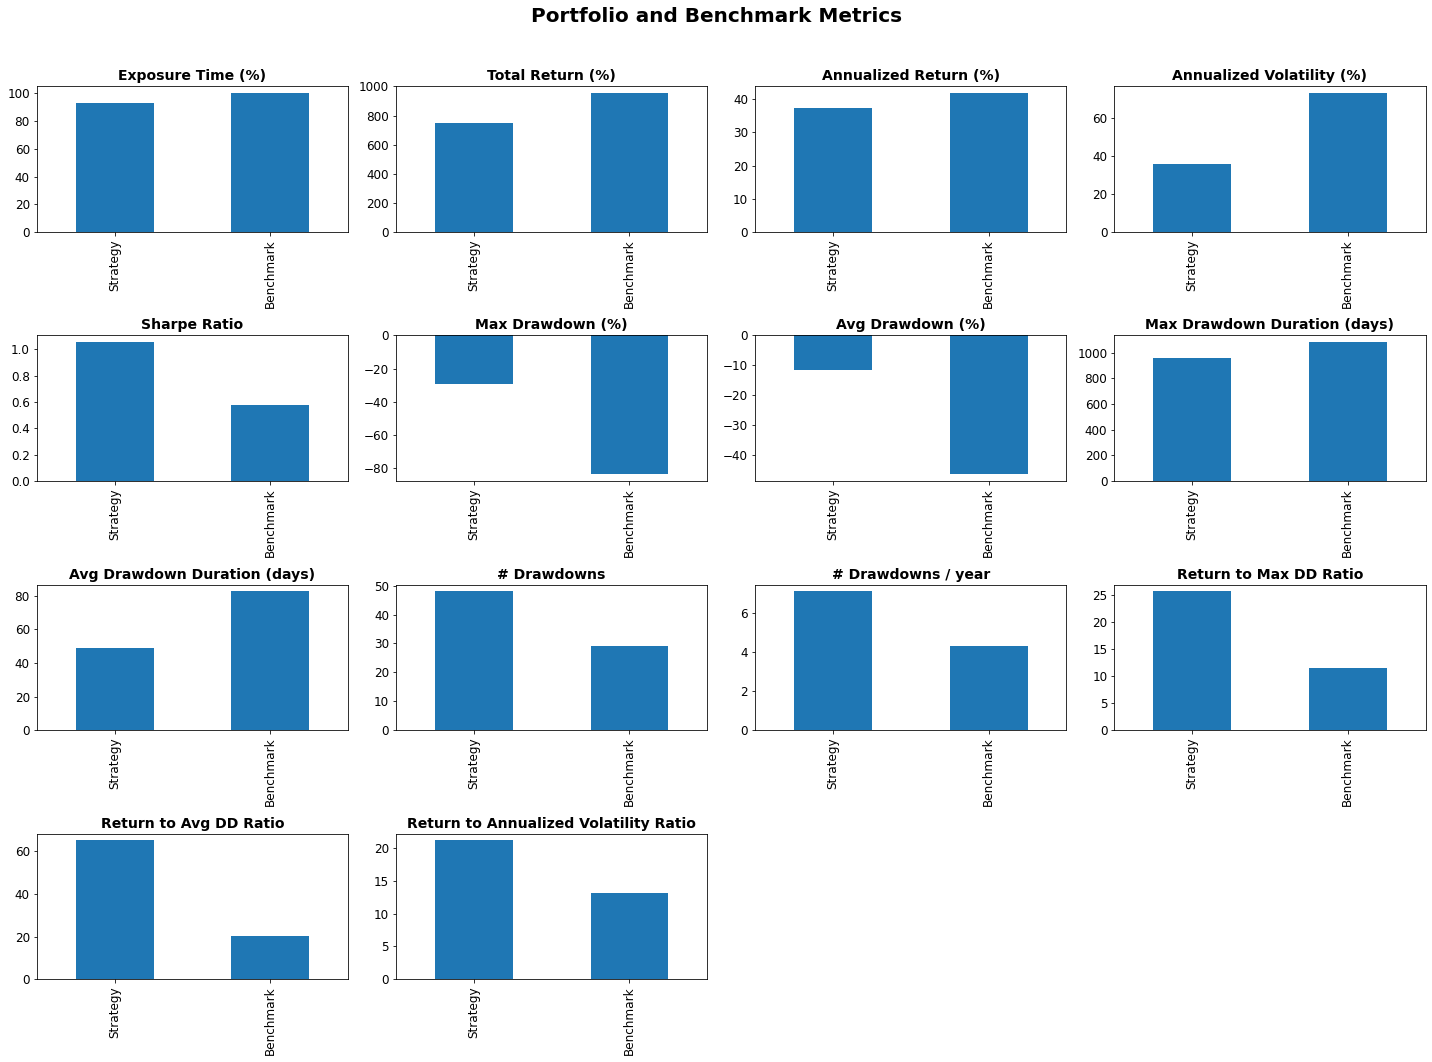
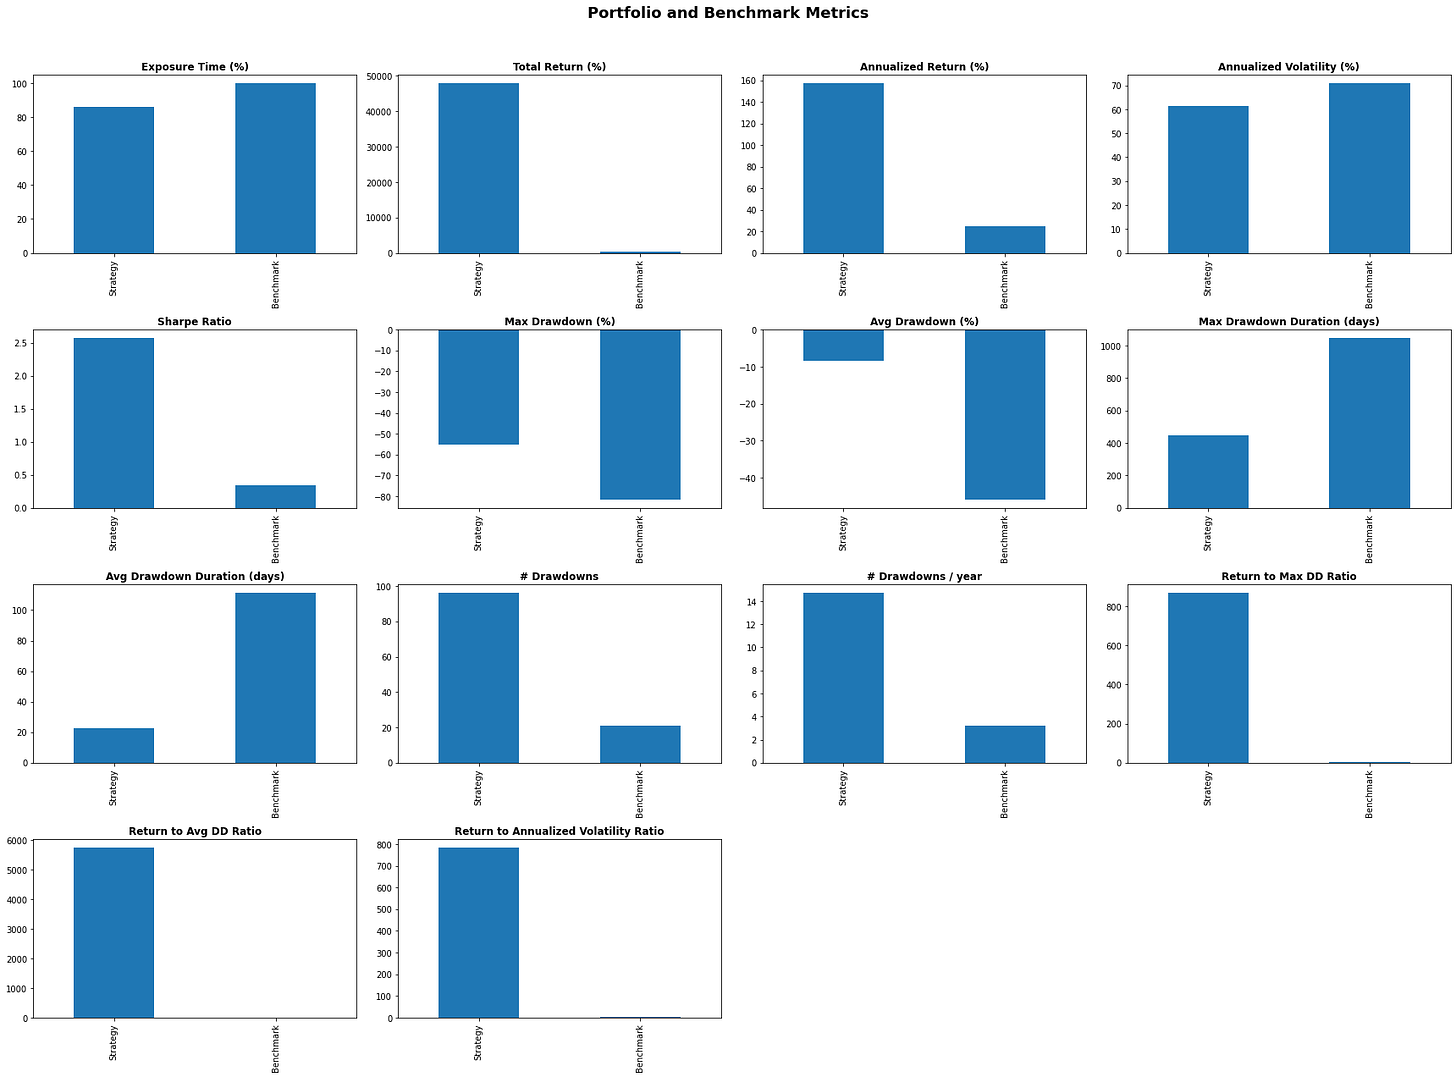
If we compare different metrics to the benchmark returns, we can see that our strategy does produce much higher returns, for each unit of risk. I like to take a look at the last 3 charts for this. The total return to drawdown, and the returns to annualized volatility. It helps me understand how much am I getting for each unit of risk I put in the market.
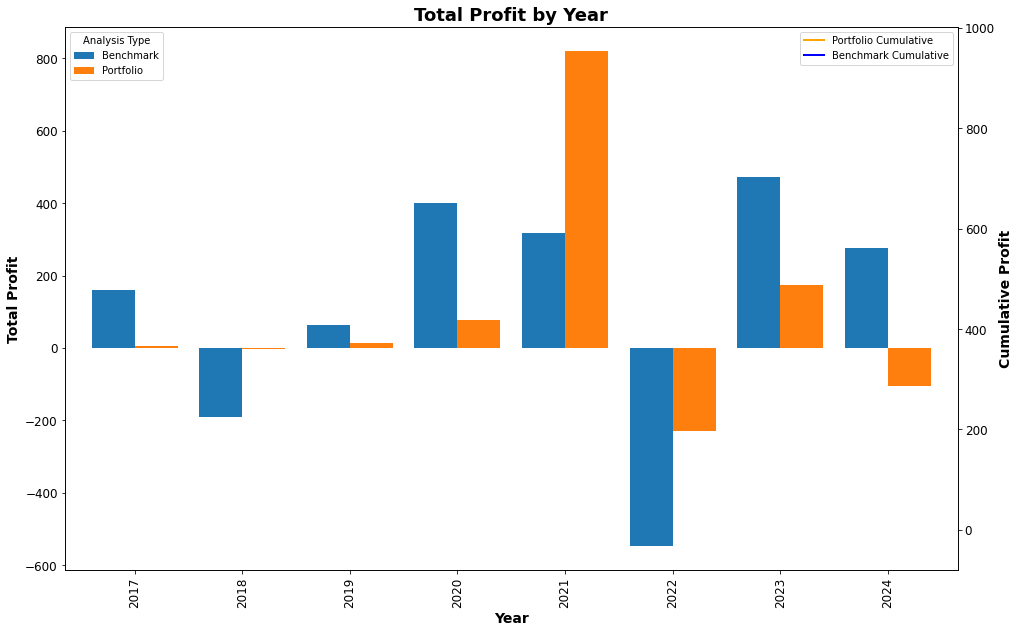
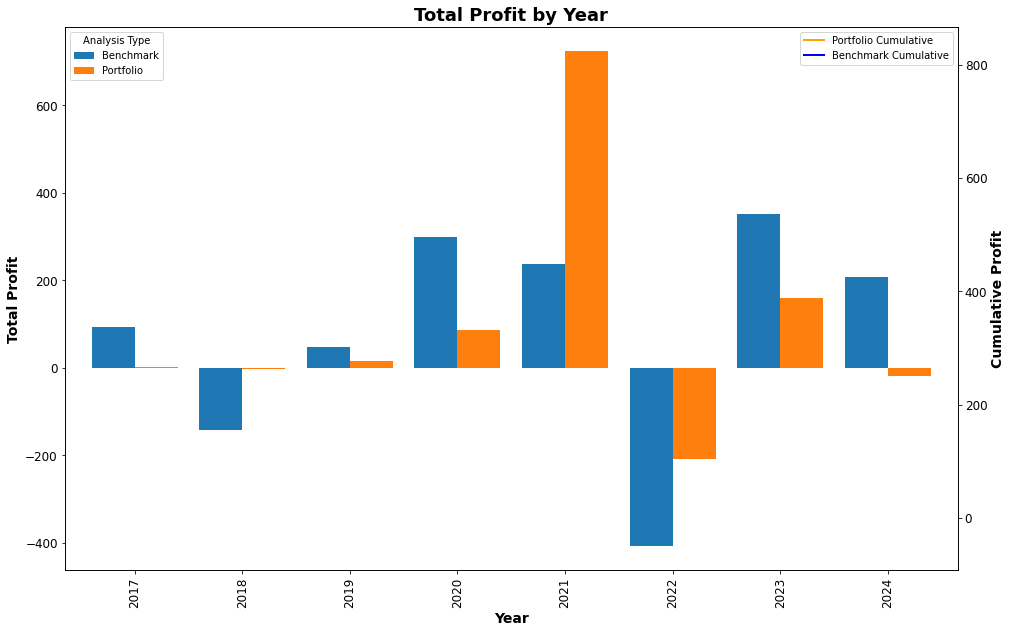
But we’re not satisfied so far. The strategy barely made any returns from 2023-2024. Most of the “outperformance”, of the current set of rules, was made during 2021, in a highly explosive market. We don’t want to be too dependent on an outlier year, to drive our returns. If we’re truly extracting returns from momentum, we need to extract it every time there is momentum, and go through drawdowns where there isn’t.
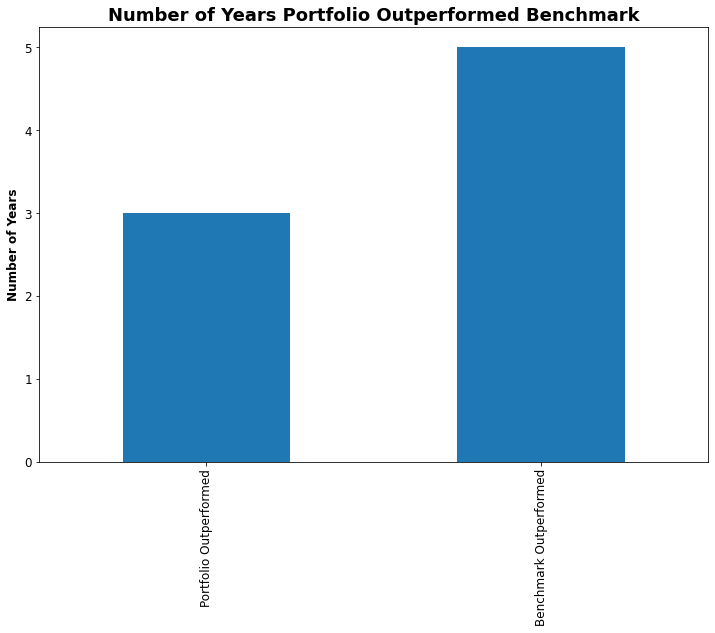
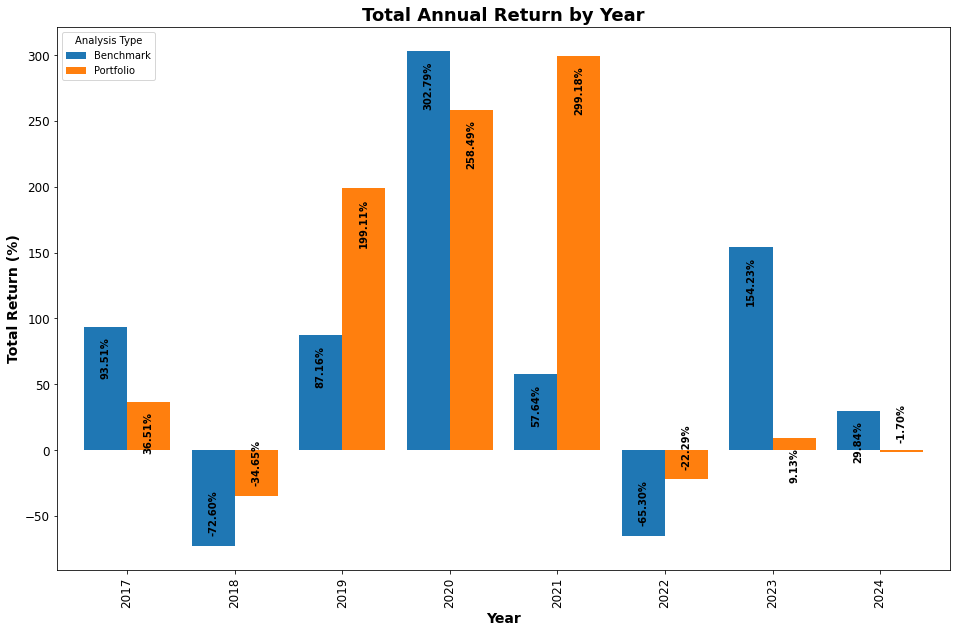
Above it’s a chart showing why the portfolio outperformed on a cumulative basis. We had a major year in 2021, that by luck, returned multiples of the benchmark, and that drove the outperformance going forward, despite underperformance. We have to be careful when looking just at total returns. We need to always look at performance on a rolling basis. Things change all the time.
Ok can we improve it, or just let it go?
I’ve changed the ranking now to be based on the last 90 days of performance, and also I’ve changed the period in which the average range of bars is measured. Instead of the previously mentioned 20 days, we added a longer window of 3-months, to measure the volatility of that time. The results become pretty interesting as you can see. Although I am still concerned and puzzled on why we couldn’t extract more returns from 2024. It just doesn’t make sense. If we have a momentum signal on our hands, we should be earning more from such regimes right?
Let’s think through why this might be the case.
Why has 2023-2024 underperformed so badly compared to a simple hold of Bitcoin?
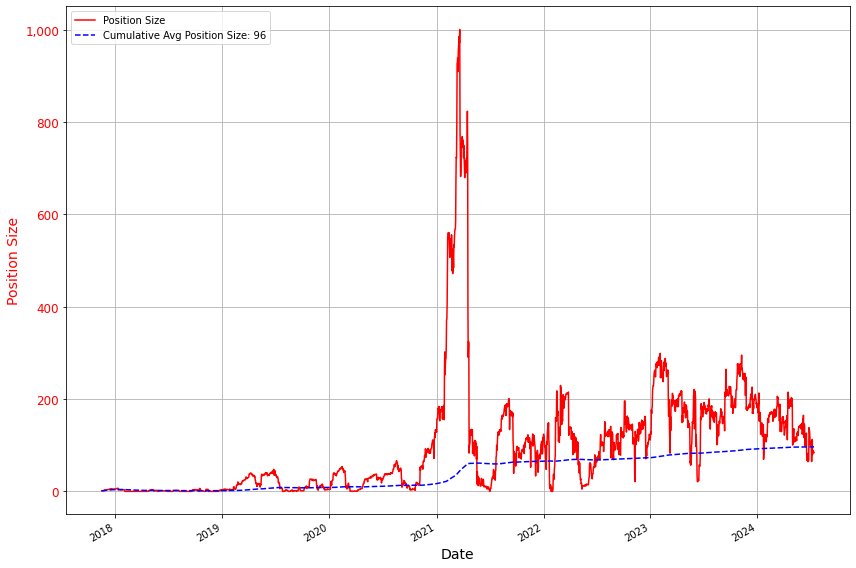
If we look at our sizing, it continues to scale as part of our compounding effect. Sure, in 2021 our size was massive, due to the open positions we carried. They inflated so hard, that it definitely had an impact on the overall size we were holding at the time. And since we are not doing any rebalancing, that is an effecting factor.
But it’s still is no reasonable explanation to why we’ve underperformed.
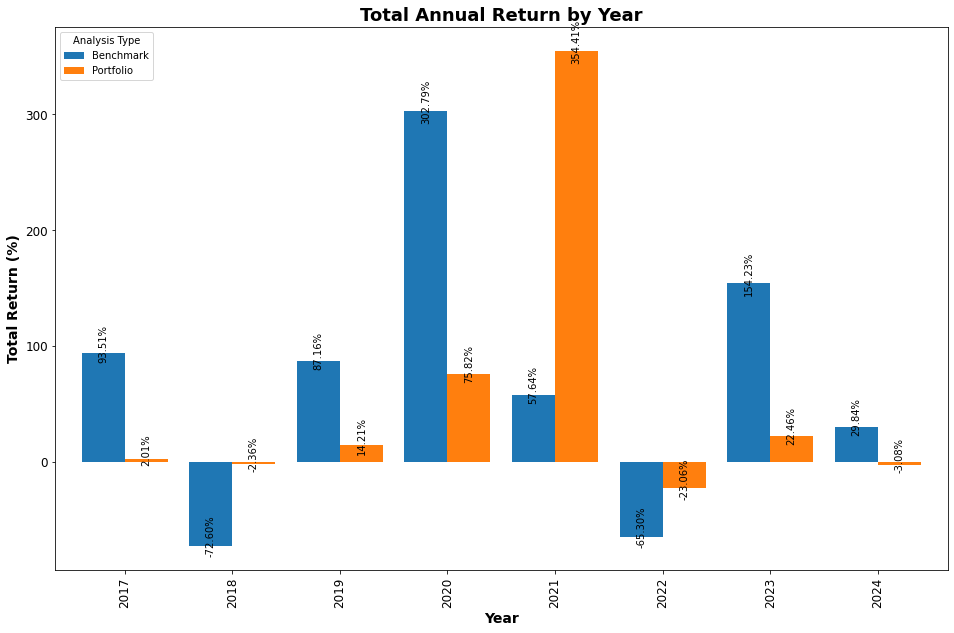
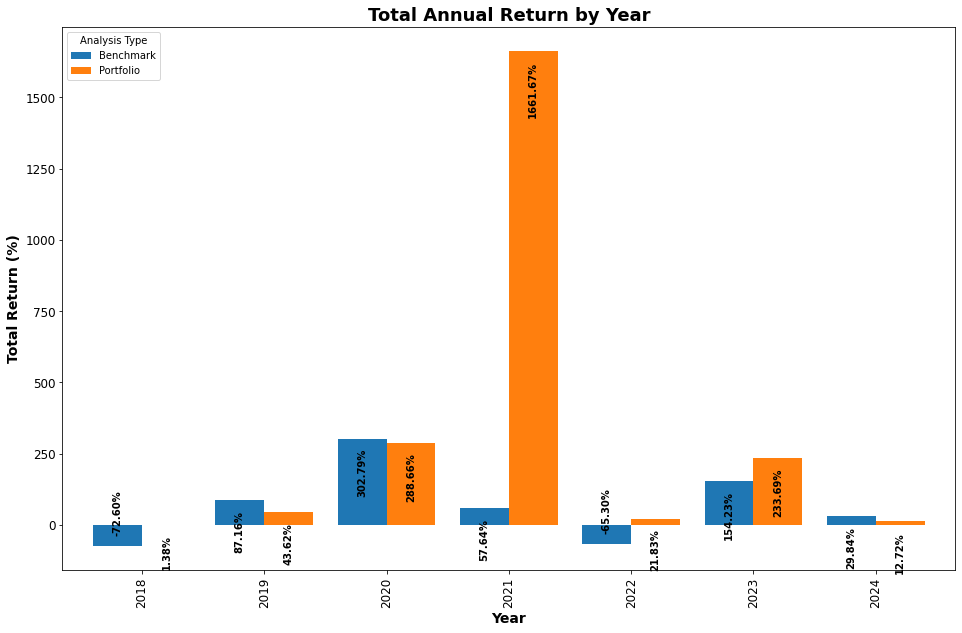
I am writing this as I think through the issues. I’ve just thought that it is dumb, that I am using $ returns by year, to compare strategies. Why is it dumb? Because if we increased target volatility, we also increase the size that we use, thus increasing $ returns for that year, without changing anything meaningful about the strategy. We want to see how much we returned in %, for the starting capital of that year instead. That’s it. So let’s make the appropriate changes in the code, and look into it.
Here we go, now we can see the drivers of returns from initial capital each year. I continue to be worried about the over reliance on 2021, as a driver of returns for the strategy.
What if the driver of that outperformance is something more subtle, as the method of targeting volatility we’re using? If that’s the case, than let’s test our in the following way:
No volatility targeting and without compounding:
We can see that the returns do improve, especially from 2019-2021. But still I can’t seem to find an explanation for the lack of performance from 2023-2024. It just doesn’t make sense. I am not very satisfied, and I won’t be giving up (I’ve allocated too much time to this article anyways eheh).
As I was exploring the individual trades of the strategy, to try and understand some context of why it’s underperforming, I noticed that there’s a lot of signals that don’t display much meaning. What I mean by this is that, they are pretty average when it comes to behavior. I want something more meaningful. After experimenting with stronger signals on the same timeframe, I didn’t find anything significant, and I don’t feel comfortable just digging further until I find something that works.
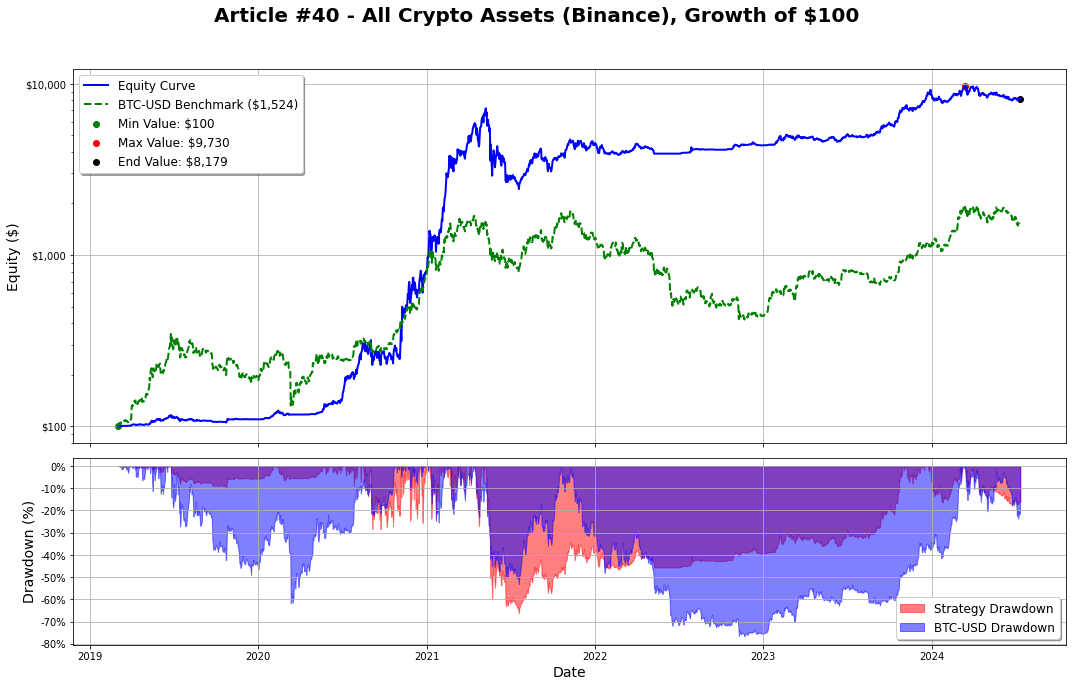
We can attack this problem in another way. Either we add more complexity to our entry signal, or we reduce the sensitivity of our input, by increasing the timeframe. Let’s test this on a weekly timeframe.
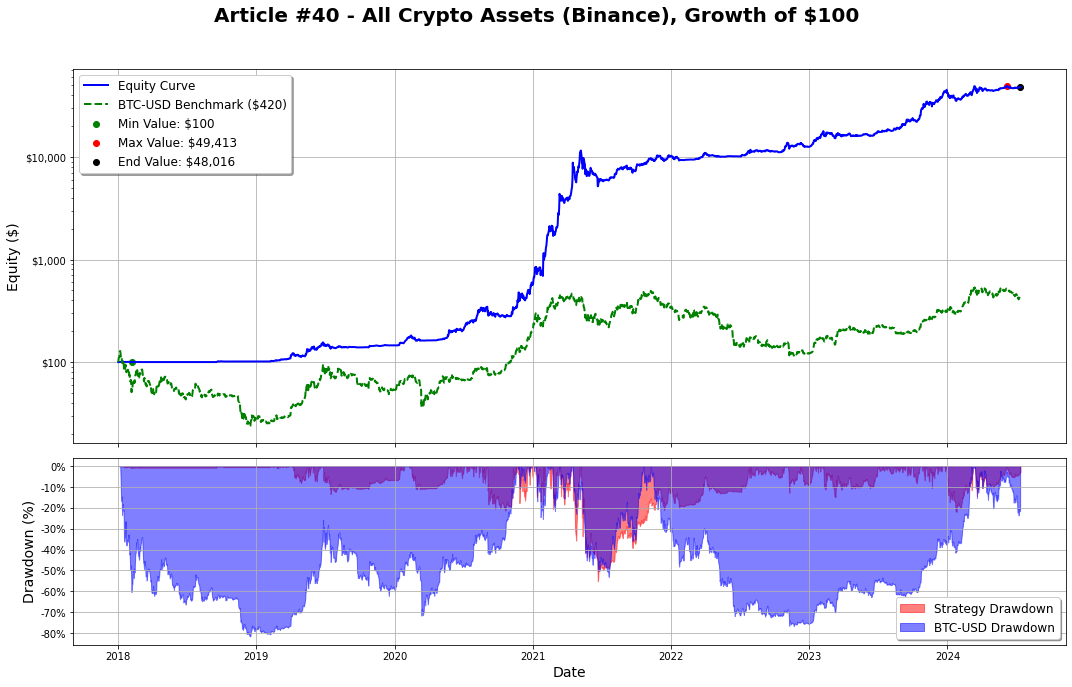
We beat BTC’s performance by quite a bit, while also decreasing the drawdowns. Remember that we targeted a 20% volatility? When I show you the data below, you’ll see that the volatility can go upwards of 70%. This is because we are not doing any rebalancing right now. Once we start doing rebalancing, the volatility will be more in line with our targeting. Just to simply explain this, if the positions can be held for longer with no control, it’s normal that that uncontrolled exposure, will increase that overall volatility. Imagine holding DOGE during it’s best period. If you’re not getting position sizes back into line, you’re holding massive positions, just because the trade is much larger than it was originally.
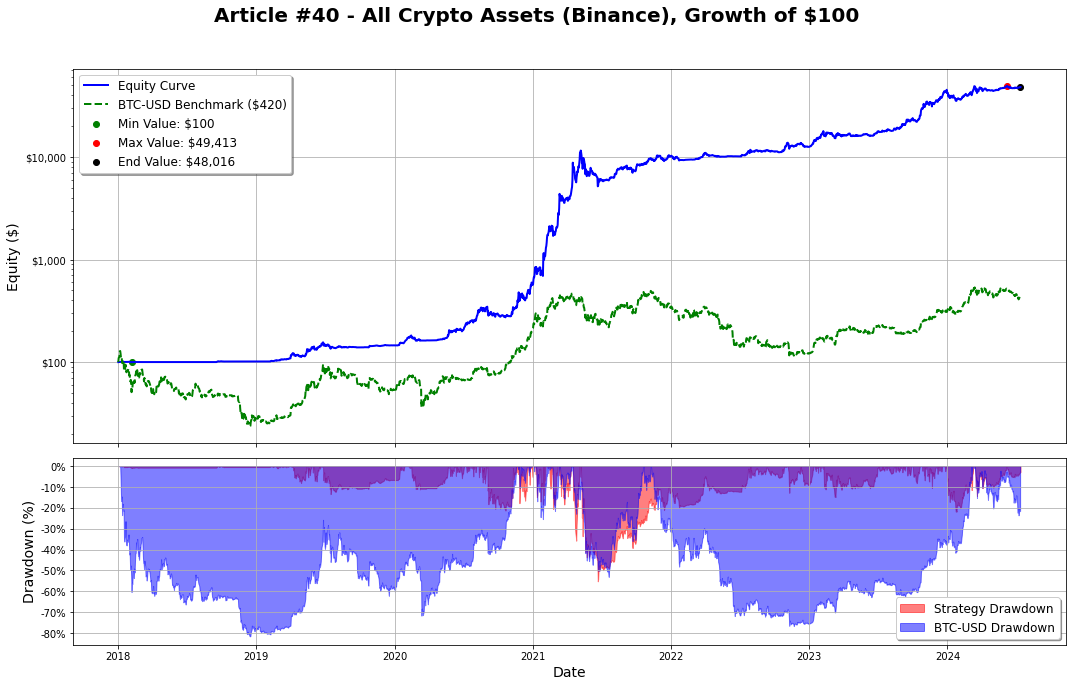
Now, on the previous example, I’ve used the 50SMA as a parameter for the exit. A 50-week type of signal might be too long for crypto, don’t you think? What if we use the a 20-week signal for the exit?
Even larger returns and better risk-adjusted returns :) .
We’ll get into it further in sections below.
Parameter Settings Overview
To get into the parameters used for this test, let’s start by reading what the author wrote
Assets: All available coins on Binance
Timeframe: Weekly
Side: Long
Portfolio: $100.00
Compounded Returns: Active
Maximum Allowed Open Positions: 15
Maximum Portfolio Size Per Position: 25%
Fees (per order): 0.1%
Estimated Slippage (per order): 0.5%
Buy Signal: Enter when close is higher than open price plus average range (high to low) of the last 10 bars.
Sell Signal: Exit position when the close is lower than the SMA(20)
Ranking: Returns over the last 90 days
Position Size: Volatility Targeting
Target Volatility: 20%-60%
Long-Only Model Performance Analysis - Conservative Risk Tolerance
If we look at the performance of our model we can take away some outputs that are more positive than others. Let’s start by the positives, then we go for the negatives.
Positive:
It outperforms Bitcoin buy and hold for a considerable amount
The return to drawdown ratio is considerably higher
The Sharpe ratio is decent
The exposure time is slightly lower than BTC’s
Negative:
Annualized volatility is pretty large.
The maximum drawdown is still pretty large.
The next step in this analysis, would be to try and reduce the overall volatility of the returns. We’ll get into this in a future article. That is achieved by doing some rebalancing, based on past volatility to match our target volatility. If we do allow positions to run wild, then the volatility will naturally be higher. Especially in very low frequency models like trading on the weekly.
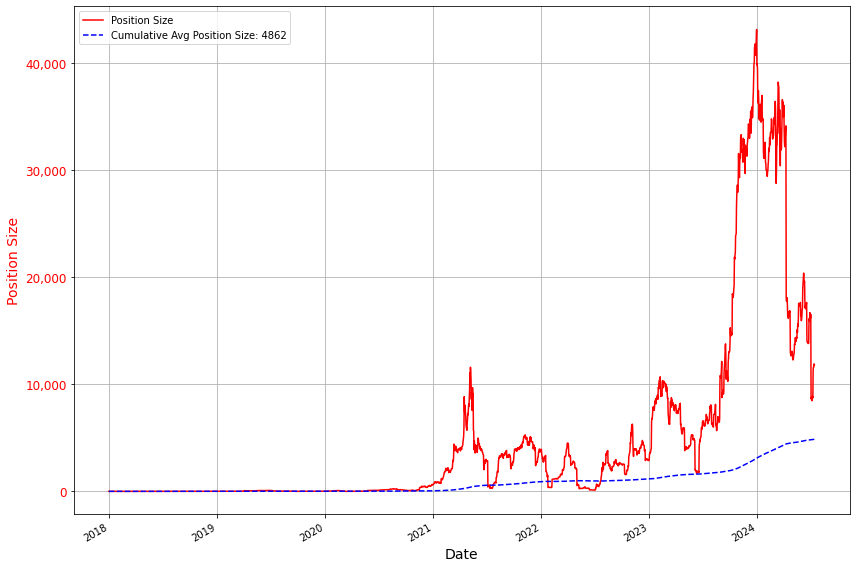
Above we have the total position size on the portfolio by date. We can see that it often goes pretty crazy right? That is what I mean. We need to put it back in place and not allow it to run wild. Sure it will produce us higher returns during awesome regimes. But it will also increase the volatility of our portfolio, which might be something that we don’t want.
I am still concerned about the reason for the underperformance in 2024, given it has been such a strong year. But it’s hard to make reasonable assumptions given such low availability of data. 6 years of data is really not statistically significant. We need decades of data to make informed decisions. Especially the lower the frequency of our models. And this is a relatively low frequency model. We had only 262 trades in these 6 years!!
We can look into other markets for more depth, and more trades, as we will do in our Equities section below.
Edge Effect in U.S. Equities
I always say this. If we’re extracting some meaningful factor from markets, I want our tools used for that extraction, to at least be useful in other markets. And that is what we can observe below.
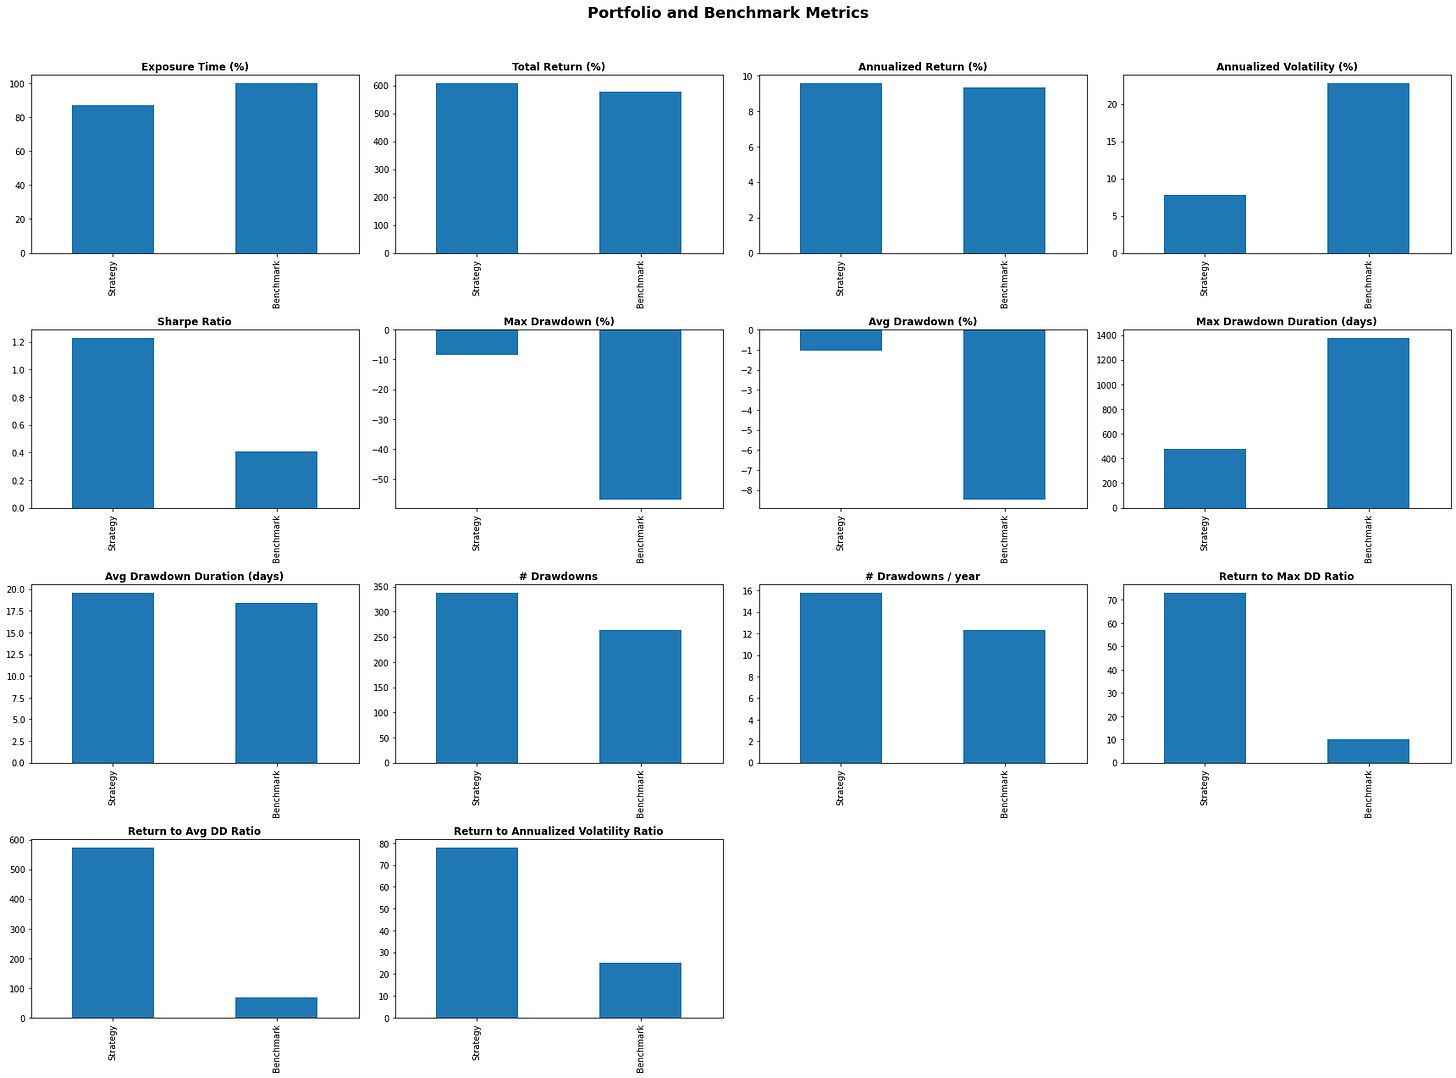
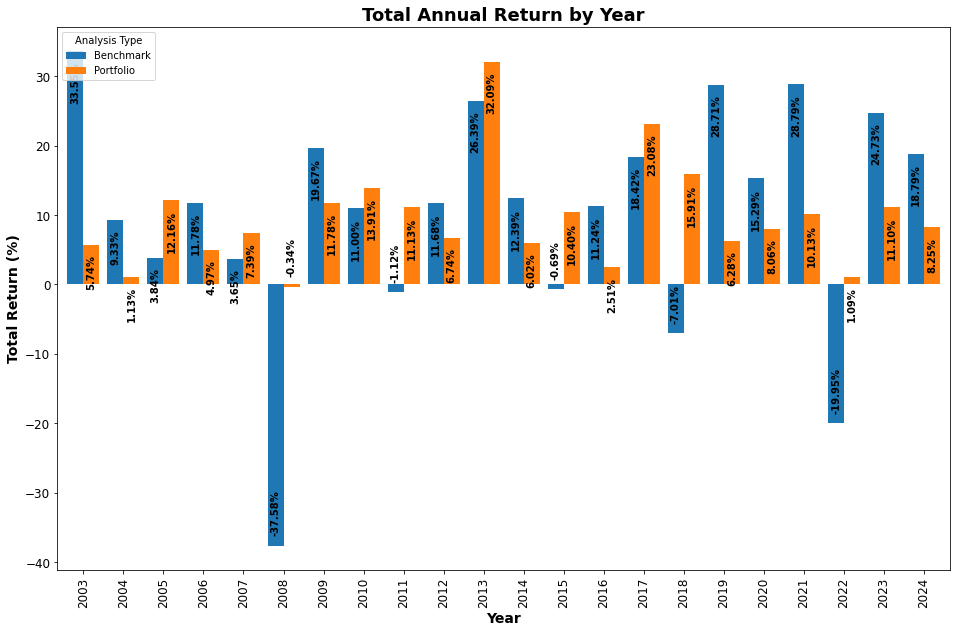
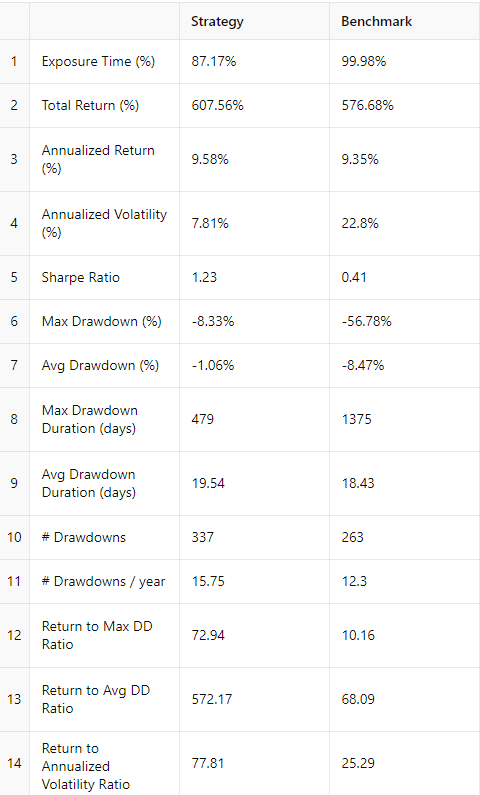
We can see that the strategy has a outperformed the S&P500 for quite a while. I didn’t use a survivorship bias free dataset though, and that can heavily impact performance. I want to make that statement as that is pretty important detail. I don’t trade equities, so I haven’t purchased a subscription for s survivorship bias free dataset yet, which I am looking into for these analysis. When we look at data, we must always consider the assumptions that we’re making.
Overall it also looks pretty good in equities, with a lot more data behind it. It’s truly fascinating to see a signal working across multiple markets. It just adds to the overall confidence, because if it has a tendency for positive expected value, in more mature markets, what can we expect from markets that are not so mature? My guess is that it will keep working the same as it did. And this achieving the robustness that we so much seek!
Conclusion
I hope you’ve liked today’s articles. This one took me a bunch of hours to think through. As I write these articles. I am also coding and thinking about the problems. I could easily run this into a machine learning algorithm and generate you an overfitted strategy. But that is not the point of these articles. I want the strategies I share to have a shot at working out.
I will be launching these models publicly on my own portfolios, with decent capital behind them soon. I am building the infrastructure and everything will be shared here. I aim to become the most public, transparent trader around, with at least 7-figures AUM, because I believe in walking the walk. I love trading, and that is what I want to keep developing through my career. I’ve always traded my own models, and frequently share my performance both here and on twitter. Many take the backseat and don’t enjoy putting risk behind their ideas. I don’t think that way. I see myself as a scientist in the search of truth. The only way to find truth in markets, is through the active practice of the game. Through risk taking.
I am also trying this new long format where I share my thoughts and more depth on the research side. I’ve got a lot of feedback from everyone, and I listen to every single one of you, and the general theme I get is that you like depth. When I started writing, I actually thought it would be the opposite, and depth would be boring. But no. I was wrong, and so I’ll adapt my articles.
It’s actually a good thing. I go into this much depth into any research that I do. Being able to write about it is an added bonus. I no longer have to summarize everything, in the desperate attempt to catch attention. I can be myself, and write about it. That’s awesome!
We’ll be improving the articles going forward. These are some of the improvements I want to add:
Rebalancing positions to match target portfolio volatility
Adding shorts into the models
Standardize analysis into single table formats rather than scattered
Let me know if there’s things you’d like to see added.
I’ve been loving doing these articles, and they do take a long time to write. I hope you’ve been enjoying them too!
Kind regards,
Pedma

