
Research Article #31 - Crypto Momentum Scanners
How did I use my crypto momentum scanners?

👋 Hey there, Pedma here! Welcome to the 🔒 exclusive subscriber edition 🔒 of Trading Research Hub’s Newsletter. Each week, I release a new research article with a trading strategy, its code, and much more.
Join over 2K+ readers of the newsletter!
One of the most frequent questions I get is:
How do your momentum scanners work?
In today’s article, I am going to show you how to use them, and how to think about them.
Looking at market behavior in the short-term, can give us a better perspective into our own positioning.
Although I don’t use this to add or change my positioning, it does help me visually understand where the market stands, and how much further is left in these “momentum periods”.
We will cover the following scanners today:


Index
Introduction
Index
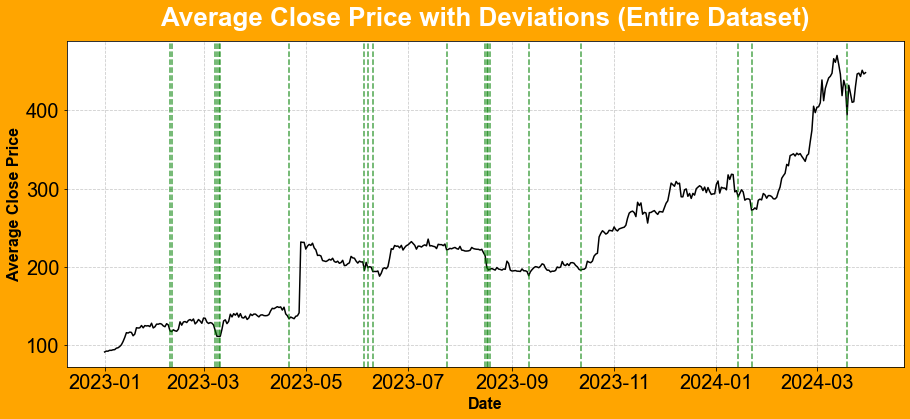
Quantifying Deviations from Average Behavior
Quantifying Length of Momentum Periods
Conclusion
Python Code Section
Sponsor Of Today’s Article
Quantifying Deviations from Average Behavior
One of the things I’ve observed in markets over the years, is that when assets have explosive moves, in a short-span of time, the likelihood of that move to continue expanding, decreases.
I’ve made the “time” part bold. This is because we are talking here about momentum. If you exclude the time element from this analysis, we start to look into trends. And trends can last for much longer, and they are completely unpredictable in their magnitude.
So I make the assumption of this mean-reverting property, based on human behavior and capital interest being finite.
At the start of a move, when an asset is still considered “cheap”, the interest is high and not much capital has been deployed.

Now this is an obvious hindsight analysis, and I am not saying that we have an accurate way of quantifying what is cheap or what is expensive.
The assumption that I make is that things that are floating around local bottom, around a mean, are less expensive than something that has had an explosive move recently.