Research Article #30 - Bitcoin January Barometer
How does January performance affect the following 11 months?
👋 Hey there, Pedma here! Welcome to the 🔒 exclusive subscriber edition 🔒 of Trading Research Hub’s Newsletter. Each week, I release a new research article with a trading strategy, its code, and much more.
Join over 1K+ readers of the newsletter!
January was found to be an effective “barometer” to help with forecasting equity index returns, for the remaining of the year.
There’s some questions if the strategy holds merit or if it’s a mere “luck” event.
The truth is, the original test had a 152-year long backtesting period.
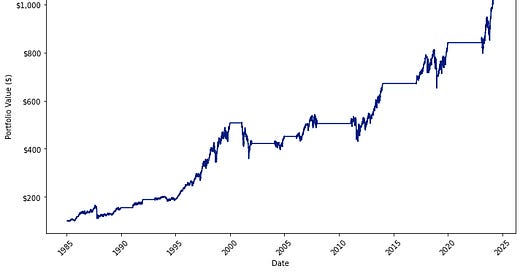
I also ran my own test on the S&P500 from 1985, and here’s the equity curve for it:
We can’t have the same historical length in cryptocurrencies, as this sector has a much smaller history, but we will use all available data at our disposal.
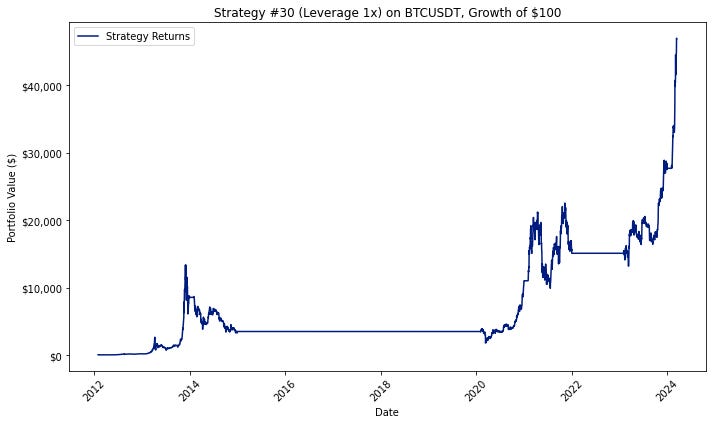
Here’s the summarized performance of today’s strategy:
Total Unleveraged (%) Returns: 46,890.89%
Win Rate: 53.74%
Annualized Volatility: 60.17%
Average Drawdown: -51.98%
Let’s get into today’s article!
Today’s research is based on this paper: link
Index
Introduction
Index
Strategy’s Thesis
Strategy’s Parameters
Strategy’s Performance and Results
Python Code Section
Sponsor Of Today’s Article
Strategy’s Thesis
There’s a saying in Wall Street:
“As January goes, so goes the rest of the year”
The term “January Barometer”, was first mentioned back in 1973 when Yale Hirsh coined the term.


