
Research #20 - Kristjan Kullamägi, an 8-Figure Swing Trader
The Story and Systems Behind Kristjan's Success as a Swing Trader

👋 Hey there, Pedma here! Welcome to this month’s free edition of Pedma’s Newsletter. Each week, I'll share with you a blend of market research, personal trading experiences, and practical strategies, all aimed at making the world of systematic trading more relatable and accessible.
If you’re not a subscriber, here’s what you missed this month:
If you’re not yet a part of our community, subscribe to stay updated with these more of these posts, and to access all our content.
One of the most interesting traders I’ve encountered is Kristjan Kullamägi. According to many reports, Kristjan has managed to grow a 9,000$ account starting in 2013, to over 82,000,000$ by 2021. This is an incredible rate of return and achievement so in this article I will cover the following topis:
His initial journey
Position sizing and risk
The strategy and rules he used
Backtest of his strategy applied to crypto
At the end of the article I will provide the code of this strategy for premium members to test it on their own.
Initial Journey as a Trader
Kullamägi started trading in 2011 as a day-trader. According to reports he managed to blow his account 4 times in the first few years. This is the classical story of many aspiring traders and certainly my own. I can’t forget the first account I blew.
However he eventually moved from lower timeframes to focus on higher timeframes and becoming a swing trader. One of the reasons he moved away from lower timeframes was indeed due to the increased opportunity when one holds for longer periods of time.
Moving to higher timeframes is a something that most directional traders in this business, given enough time, will naturally lean towards as their accounts get too large for the timeframe they’re trading or the volatility and noise becomes something that they can’t stomach long-term. If you’re a reader of my content, you know that most of my trading is based on the weekly timeframe.
Position Sizing and Risk
Kristjan says that for this strategy we should never have more than 30% of a position held over night, which allows us to estimate that his positions usually take around 10-20% of account size. A size that I personally keep for my own trading also.
His risk for each position fluctuates between 0.25%-1%. If we make the assumption of an account of 100,000$ we can calculate that:
Max position size: 10,000$ - 20,000$
Risk on position: 250$ - 1,000$
When Kristjan had a smaller account, in order to grow the portfolio faster, he used a more aggressive maximum risk on position of 0.5%-1.5%.
He admits that at the beginning when we was starting out, he risked more than this but due to the fact that he didn’t have a full grasp of risk management and position sizing.
The Breakout Trade
The initial thesis for this strategy is that if we study thousands of the biggest winning stocks over the past 100 years, they have a tendency to move higher in a slow but consistent increase over time. He also mentions that they can make a 20-50% initial move, pull back, go sideways and then make a new leg move.
The first thing that Kristjan wants to see is a 30%-100% increase in price over the course of a few weeks with the 10,20 and 50 simple moving average on a rising trend.
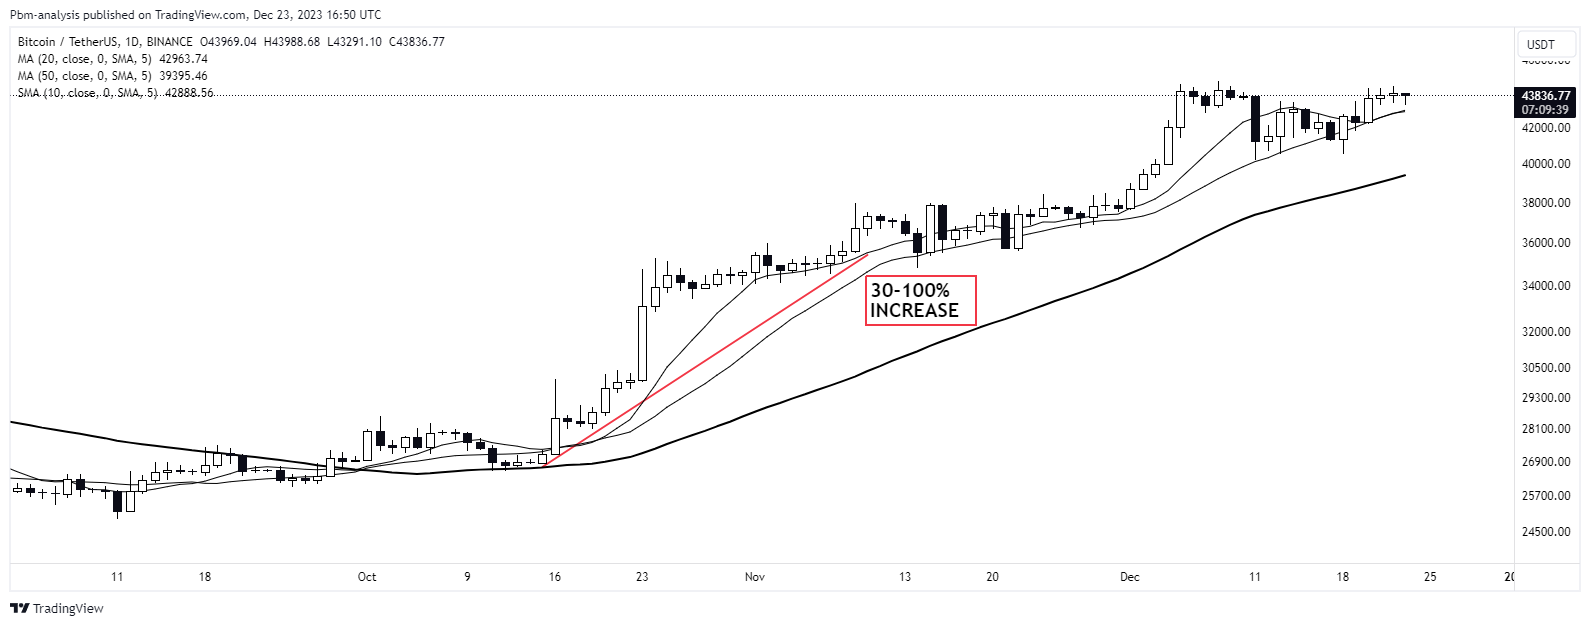
Next we need a consolidation to be formed for at least 2 weeks with a maximum duration of 8 weeks, and we need to know the highest and lowest points of that consolidation so that we can measure the trade when it breaks out.
Highest point: 38,499.90
Lowest point: 34,446.30

As price breaks out of its consolidation we can now buy the position and set our stop loss at the low of the breakout bar. Note that the stop can never be higher than the Average True Range (ATR). Since we don’t know the final ATR at the breakout bar (since the bar isn’t closed) we will assume that we use the bar right before the breakout bar as our indication of the ATR.
Entry Price: 38,499.9
Stop Loss: 37,600
ATR: 1197.10
Distance from Entry Price to Stop Loss: 38,499.9 - 37,600 = 899.9
Distance < ATR: YES

Managing the Trade
Kristjan suggests to sell 1/3 or half of the position 3-5 days after entry and then move the stop to breakeven. The remaining position then it’s trailed with a stop using the 10 or 20 day moving average. If the price closes below the moving average then the trade is closed

Statistical Backtest on Top 20 Cryptocurrencies by Market Capitalization
I’ve chosen to test this strategy on the top 20 coins by market cap since the crypto sector is where I focus most of my time on and the concepts of this type of strategy should translate well into other assets that exhibit momentum and trend. If it doesn’t, then it’s a red flag to me in terms of robustness. Let’s allow the data to give us answers.
Here’s the list of assets used on this test:
BTCUSDT, ETHUSDT, SOLUSDT, BNBUSDT, XRPUSDT, ADAUSDT, AVAXUSDT, DOGEUSDT,. DOTUSDT, TRXUSDT, LINKUSDT, MATICUSDT, LTCUSDT, UNIUSDT, BCHUSDT, ICPUSDT, XLMUSDT, NEARUSDT, ATOMUSDT, INJUSDT
For simplicity purposes I didn’t use complex sizing mechanisms, I assumed an equally weighted division of the portfolio amongst all of the assets. For example for this test I’ve used a 100,000$ portfolio, which means for 20 assets we will have allocated 5,000$ per asset. This is not optimal portfolio allocation for a serious strategy but I want to keep it as simple as possible.

Clearly we have positive performance from this strategy driven by a highly momentum based market. Readers with more experience may be wondering why is that massive spike in current performance? That is due to the fact that some of the assets we’ve used have had massive performances lately and that is also one of the reasons they are on the top market cap list.
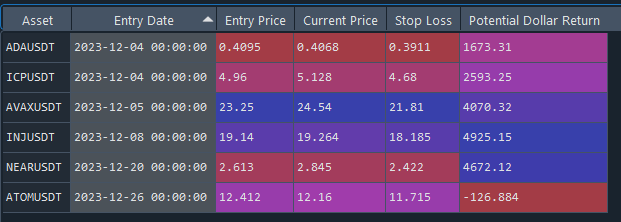
This is why we always must be careful when we test strategies on a set basket of coins based on market capitalization. This metrics shift across time and are highly dependent on current performance. We need to ensure that our testing is not filled with survivorship bias so that we are not deceived by testing only on coins that have survived. But for the purposes of this article, we will keep it to the highest market cap coins.
These are the simple metrics of the strategy performance:
Total Closed Win Trades: 24
Total Closed Lost Trades: 65
Total Closed Trades Win Rate: 26.97%
Total Open Trades: 6
Average Win Trade: 30.90
Average Loss Trade: -4.36
Ratio Avg Win to Loss: 7.09
Overall it is a decent strategy to investigate further and a lot of the concepts can be applied into other systems. It is based on solid principles of strong momentum trading and it should so well in most asset classes that exhibit these traits. I haven’t put too much focus on more portfolio based metrics like drawdowns and portfolio volatility as those will heavily depend on what risk strategy you employ on your own portfolio. Make sure that you test this strategy thoroughly before using it but we do have something to work with right here.
Strategy Code
Dependencies: The script requires several Python libraries:
pandas: For data manipulation and analysis.binance: Binance API Python wrapper for interacting with the Binance exchange.datetimeanddateutil.relativedelta: For date and time manipulation.matplotlib.pyplot: For plotting and visualizing data.ta: For technical analysis indicators.
Functions:
connect_to_binance(API_KEY, SECRET_API_KEY): Connects to the Binance API using the provided API and secret keys.get_spot_data(client, timeframe, days_range, selected_assets): Fetches historical spot data for the specified assets from Binance.strategy_backtest(data, portfolio_value, risk_trade_percentage, min_days_in_consolidation, max_days_in_consolidation, min_perc_increase): Backtests a trading strategy using the fetched data.
User Input Section:
API keys for Binance are required (
API_KEYandSECRET_API_KEY).Trading parameters like
portfolio_value,risk_trade_percentage, and consolidation period settings need to be defined.A list of cryptocurrency pairs (
selected_assets) to analyze is specified.
Data Fetching and Backtesting:
The script connects to Binance, fetches historical data for selected cryptocurrencies, and then performs a backtest of the trading strategy.
Output:
The script outputs visual plots of individual and average portfolio performance.
DataFrames for closed trades, open trades, and all portfolio values are returned.
Execution Steps:
Define Binance API keys and trading parameters.
Connect to Binance and fetch data.
Backtest the trading strategy with the fetched data.
Customization:
Users can modify the list of cryptocurrencies and adjust trading parameters according to their requirements.
Note:
This script interacts with live financial data and potentially executes trades; hence, it should be used cautiously. Ensure the security of API keys and understand the implications of automated trading.