👋 Hey there, Pedma here! Welcome to this free edition of Trading Research Hub’s Newsletter. Each week, I release a new research article with a trading strategy, its code, and much more.
Join over 4K+ readers of the newsletter!
For the past few weeks I’ve been working to improve the content of the newsletter, getting more strategies developed, increase the frequency of the posts, and I’ve been neglecting our Portfolio Management updates that I was doing more regularly.
So… What better time to post an update, other than during a drawdown, eh?
It seems that the theme is that I only post about my performance during drawdowns. I am happy about that. I’d rather show you the bad first, and the not so bad occasionally. Last portfolio update post was in January. At that time I was going through a 47-day drawdown.
There’s a lot of new people that subscribe to the newsletter that don’t know what kind of trader I am, what do I do, and what kind of results I’ve had over the years, so I’ll go briefly over that to give a bit of context.
Most traders/investors shy away from showing their performance during bad periods, but I do strongly believe that that doesn’t help people trying to learn, and isn’t transparent about the business itself.
When I was learning to trade, I loved to see P&L’s and equity curves of traders to compare to mine. If I was going through a bad time, and I couldn’t explain why, I wanted to see if others in the same niche as mine, were going through them. I also took a lot of comfort from reading about their mindset, going through those bad periods.
This is a tough business. You need to know what you’re doing if you’re going to survive long-term. And you need to survive long-term, if you’re going to be exposed to regimes, where your equity really grows exponentially. And there’s no way around it. You will go through drawdowns. The smartest traders, funds, investors, all go through them. What distinguishes a good trader from a bad one, is how you handle them, and your ability to survive the worst.
Let’s get into today’s article!
Index
Introduction
Index
Summary of My Story as a Trader
Crypto Market Report
Personal Portfolio Performance
Summary of My Story as a Trader
I’ve been a managing my own portfolios since late 2017, when I started dabbling in small cap U.S. equities. Back then I had no real approach to what I was doing. I had a conception of a system, but no systematic way of execution. I was basically just trading by looking at the order book, and what I saw on the chart. Which in my opinion, is not a very efficient way to be successful in the field. Sure, some traders do well trading that way, but that was not me.
I failed and failed up until 2019/2020, when I decided that something needed to be changed in the way I was trading.
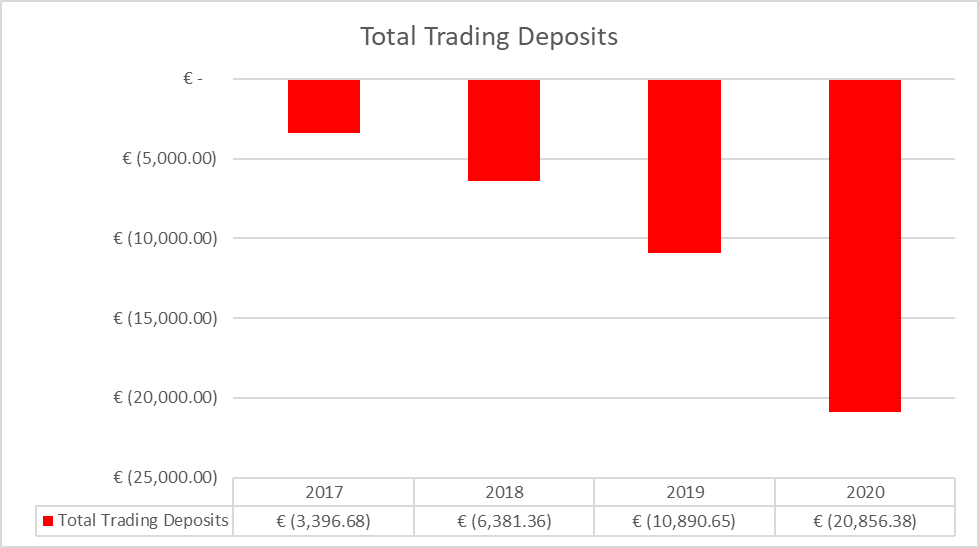
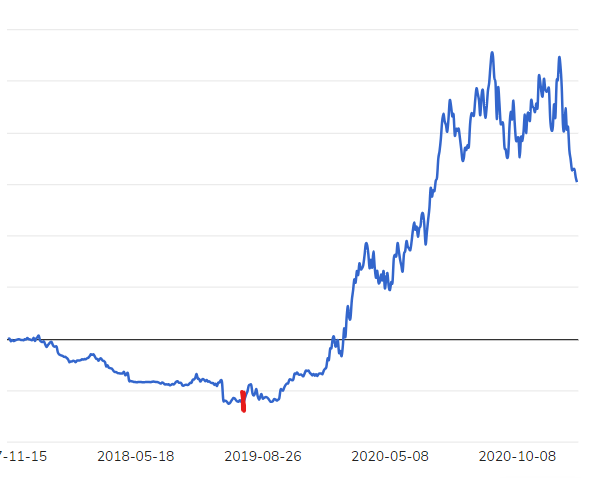
At this time, I had lost a cumulative amount of almost €21,000. You might be thinking that it is not a large amount. True, but I was just 22-years old here, and my monthly salary was around €1,200 at the time. I am from Portugal and salaries are much lower. So this was a massive amount to me at the time. I made a more detailed post about this period here.
I eventually did recover it all and plus a lot more. You can see on the chart above from Tradervue the recovery after that. The recovery was due to a few reasons:
I changed my approach from a discretionary trader to a full systematic trader
I caught a regime that was favorable to what I was doing.
Number 1 was a big factor on why I was able to capitalize on the regime that followed in 2020. Had I not done that, I would still be losing money every month. This is why I am always talking about systems and why traders need to systematize what they do. After all, that’s what worked for me.
So I started to trade a system that consisted on buying intraday breakouts, with a fixed stop loss and take profit target. I was also shorting the opposite signal. I was doing that every day. I’d come to the market, place my orders at the start of the day, and walk away. It was a great time. I was making money almost every month.
I wrote a bit more about that time period here.
But I was still an unexperienced trader that hit a very good regime and was doing well. That regime eventually shifted, as we know, and I started to lose money instead of making it. Liquidity started to dry up, fees and slippage started to pile up, and the little margin I was making on my trades, started to become too low to pay for the losses. I didn’t understand this at the time, and was quite a frustrating period of my life. Imagine making money almost every month, after losing it for nearly 3 years. I thought I was losing the edge I had. When in fact I didn’t have much edge, I was just exposed to the correct regime. Sure the systems were also too naive. I don’t think that trading intraday is a very smart thing to do after costs, but back then, I didn’t know about that.
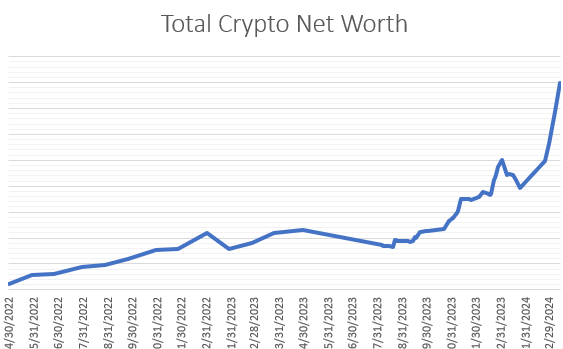
In 2021 I switched to crypto, after seeing the opportunities of the sector. I arrived near the top of the cycle. And that is the sector I’ve been trading ever since. It has been a tough road since then, but I am very happy about what was achieved.
So how do I trade today?
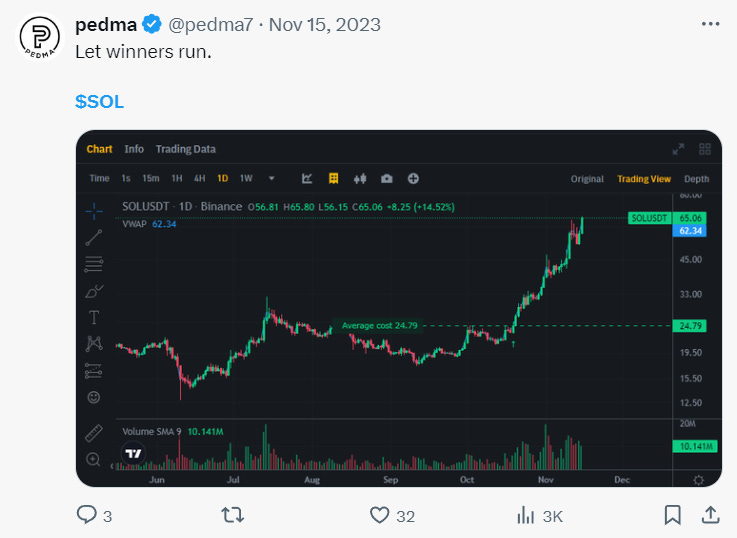
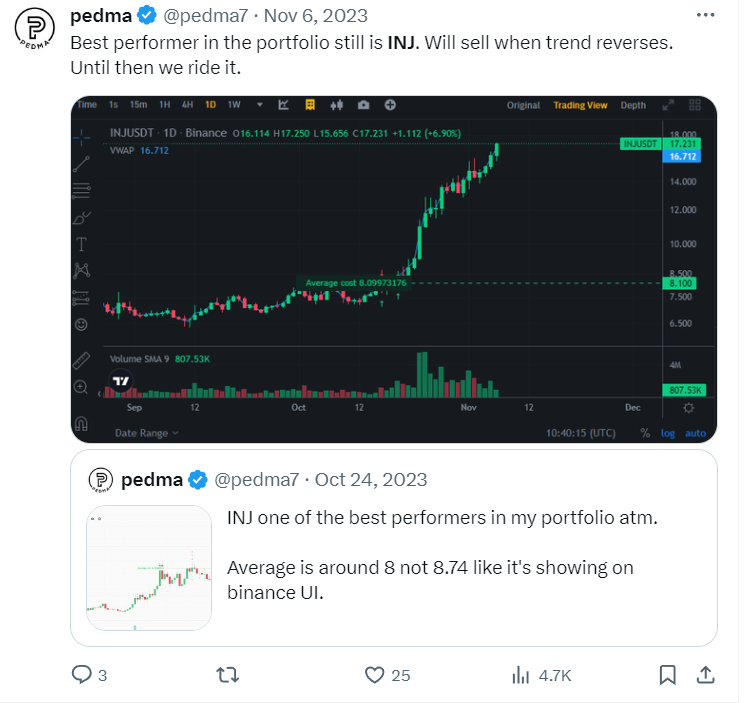
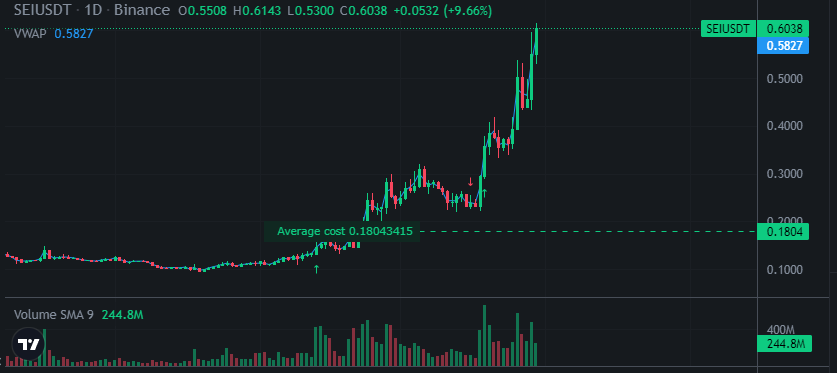
I am a systematic swing trader. I trade a long-only trend model, that focuses on buying strength and selling weakness. My average hold is around 23 days. I use the weekly timeframe to get signals to my trades. That is basically the essence of the system. Here’s an example of a few of my best trades this cycle:
There’s a lot more but this email is getting pretty large now. But you can see the theme. I buy things on the way up, that give me a trigger on the weekly timeframe. I use weekly timeframe because it helps me filter out weaker trades and focus on the larger trends. The downside is that, I am usually getting in later than other traders, because it’s lower frequency. But I am aware of the choice I’ve made, and I believe it will be superior in the long-run.
So now you have a bit of context of my past as a trader and what I do now, let’s get into today’s report.
Crypto Market Report
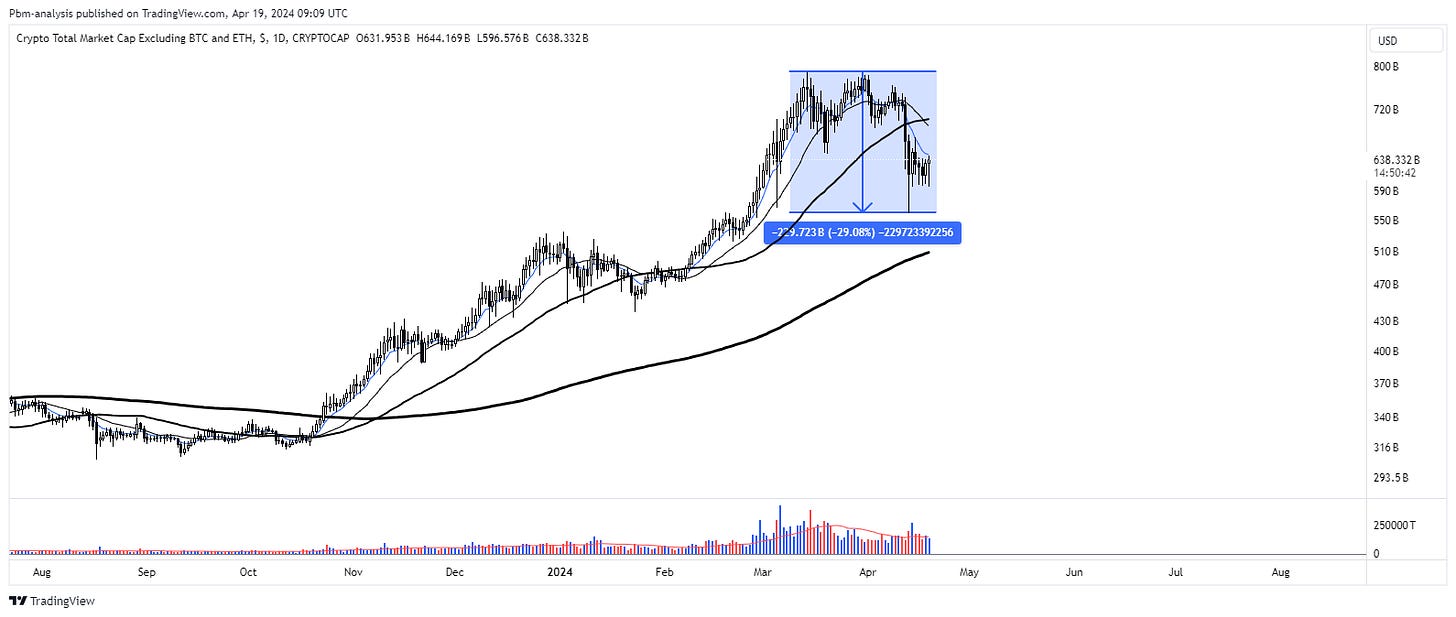
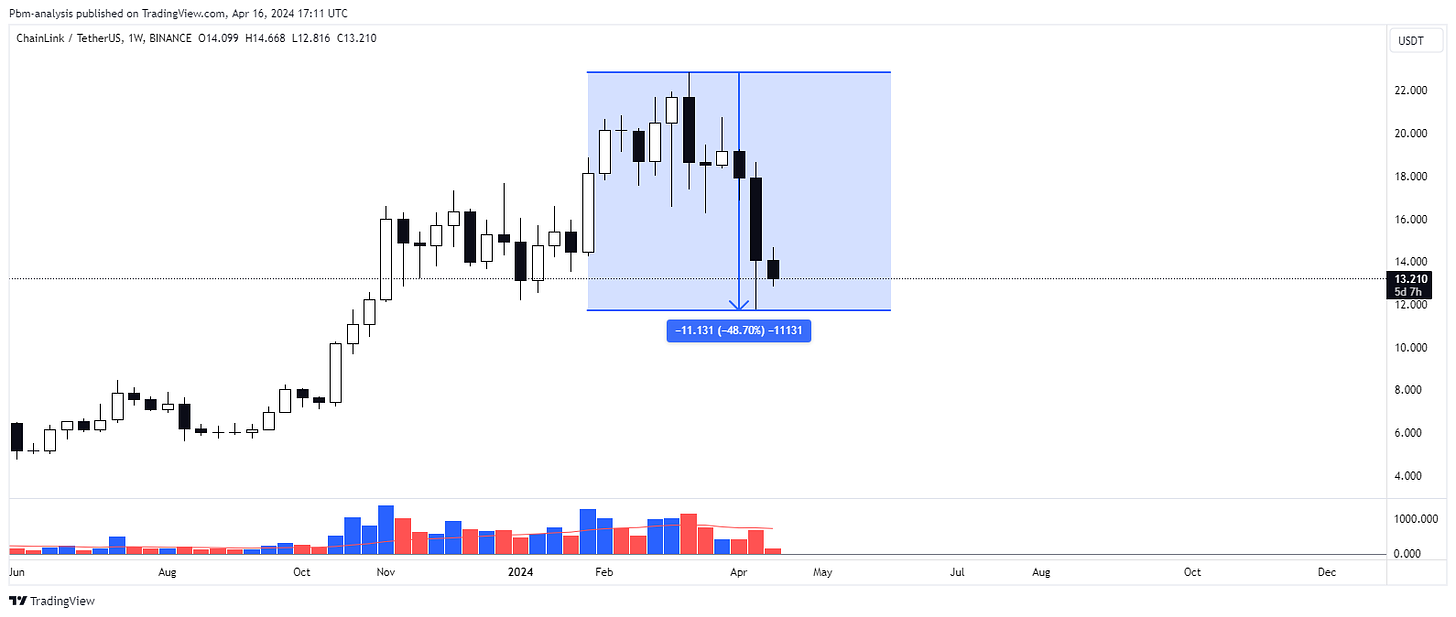
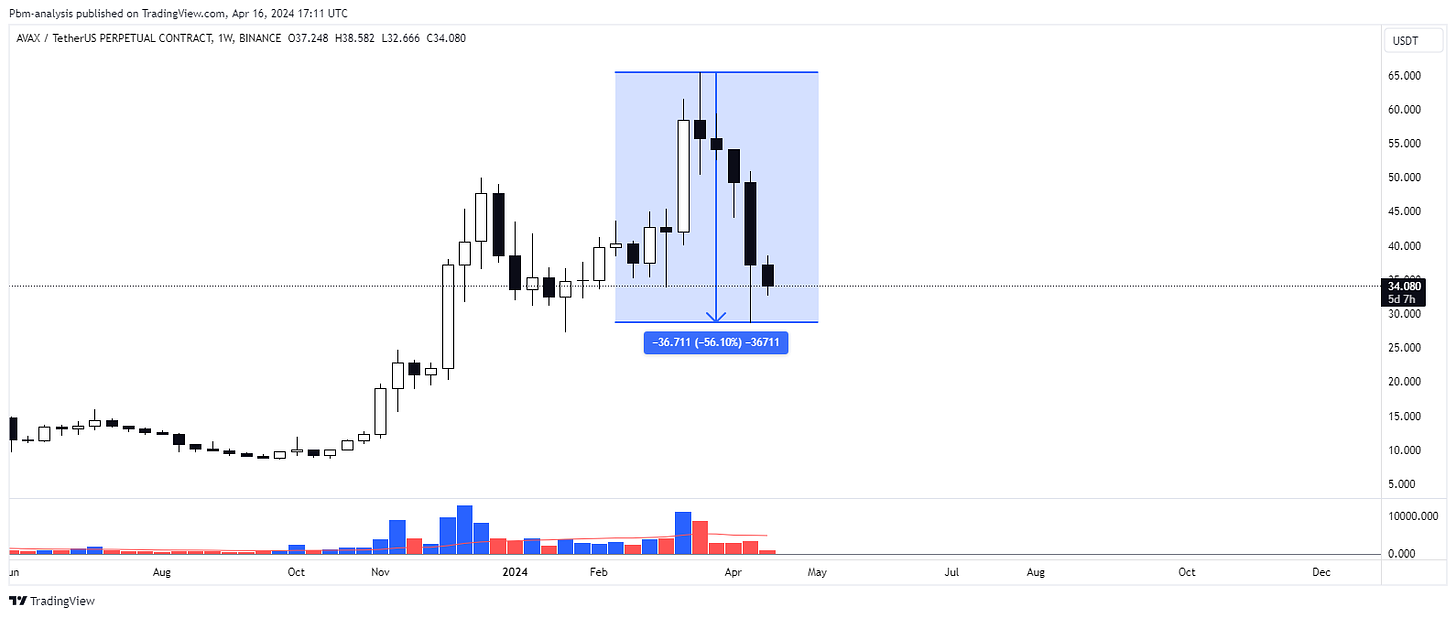
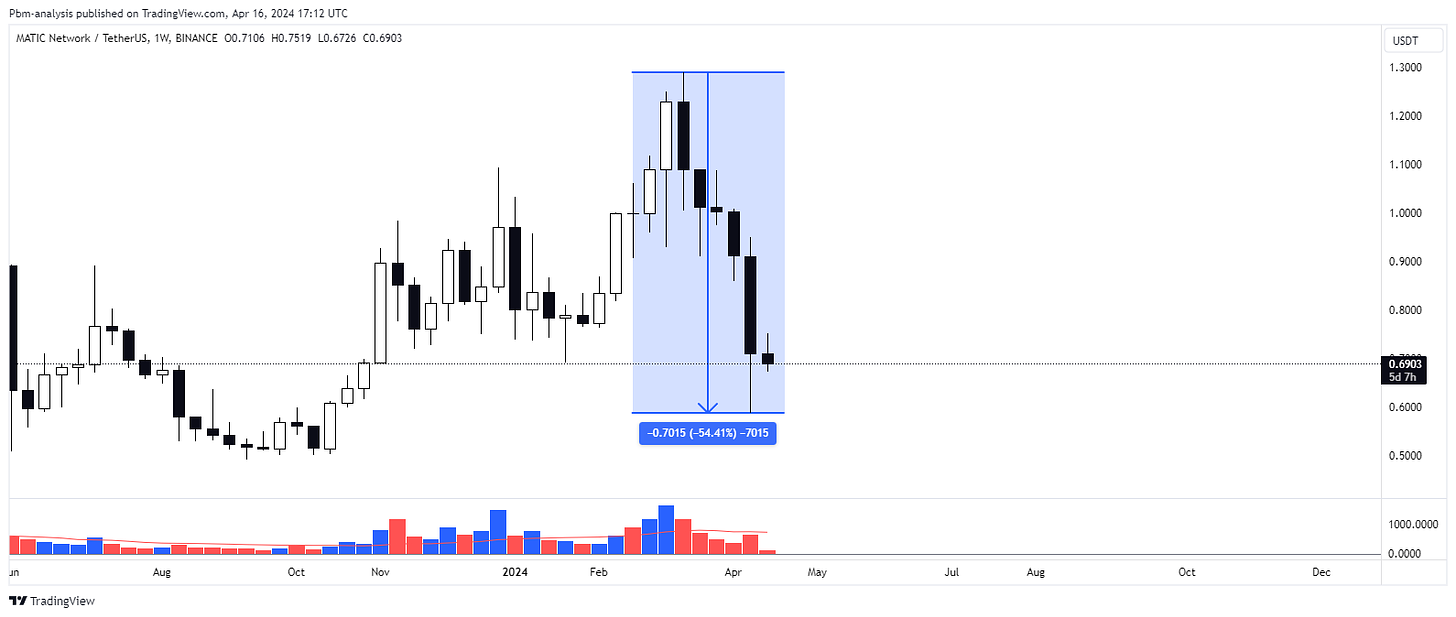
The current top for the altcoins market was in March 14th. After that we’ve had a decline of almost -30% from that top. And that doesn’t even reflect the actual damage that some of these altcoins have had.
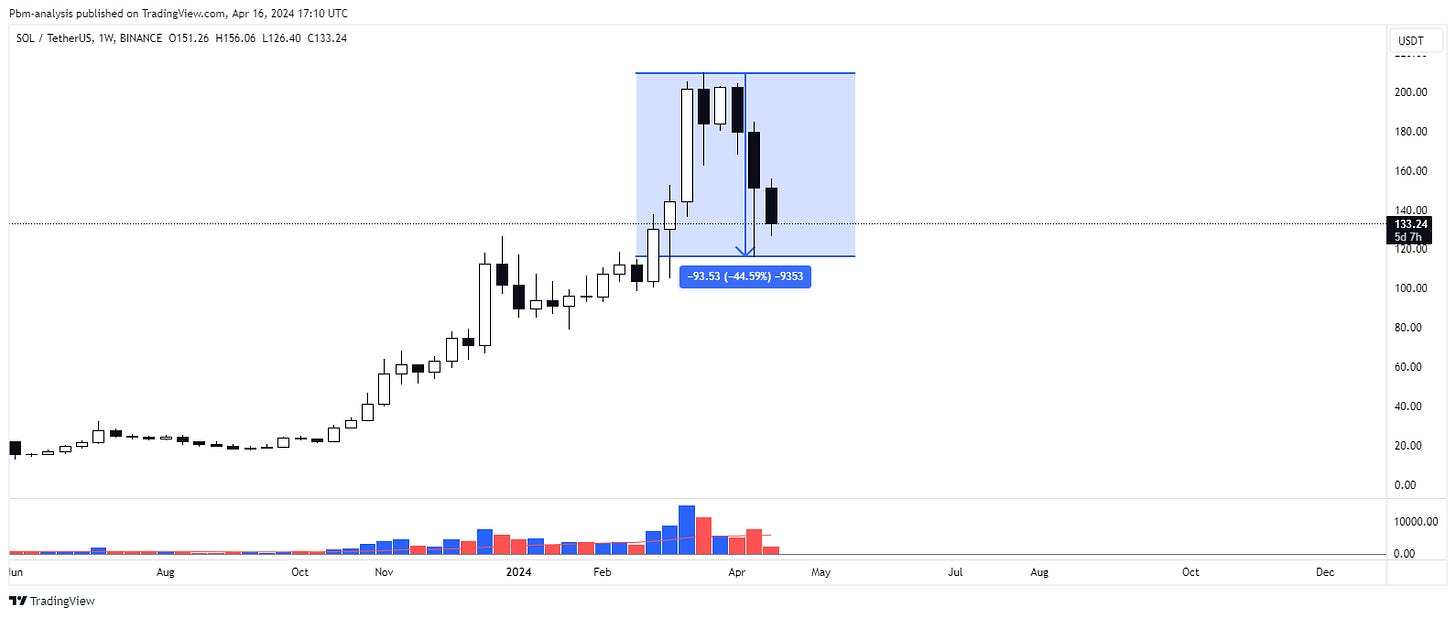
Let’s look at a few examples:
SOL: -45%
LINK: -48%
AVAX: -56%
MATIC: -54%
It has been pretty rough for holders of these assets, and that’s why we focus on systematic trading where opinions don’t matter, only expected performance.
If you’re having a tough time trading this market, know that this is normal, you can’t outtrade a bad market, in most cases. Don’t let posts on social media of traders with linear P&L curves deceive you. They are mostly fake. When sudden volatility enters the market, and it goes against your positions, is normal to have a period of bad performance. Accept it. Don’t try to fight it. Just be smart about it and manage your risk.
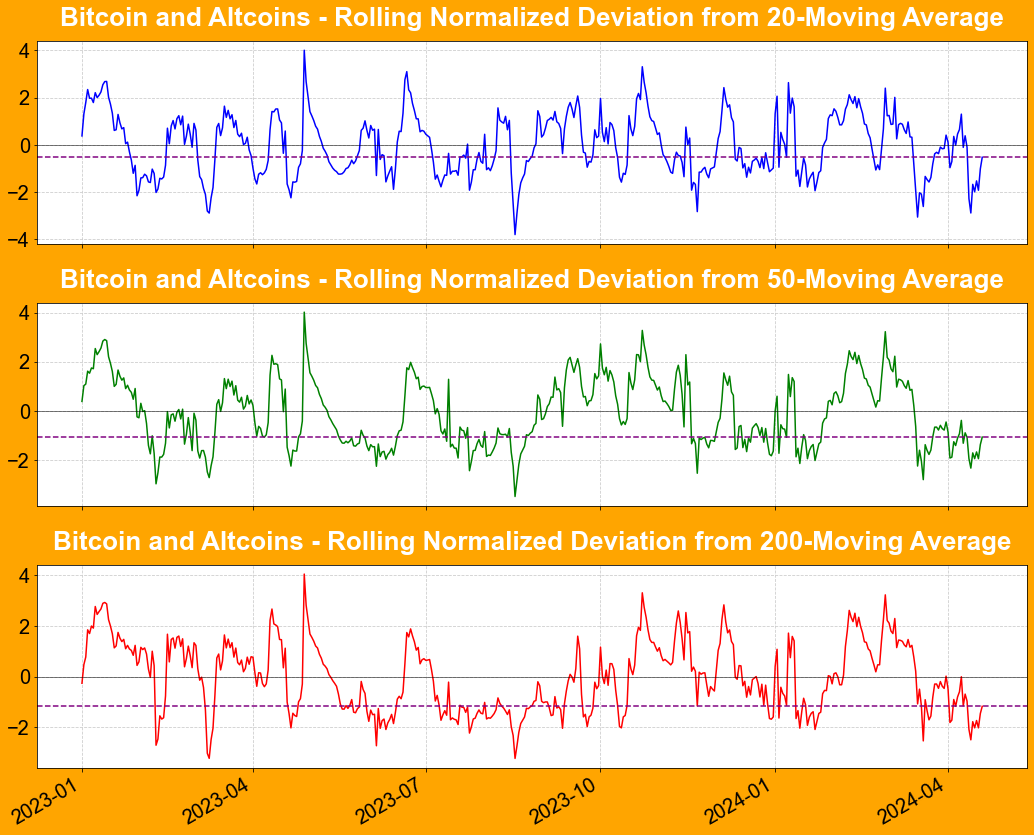
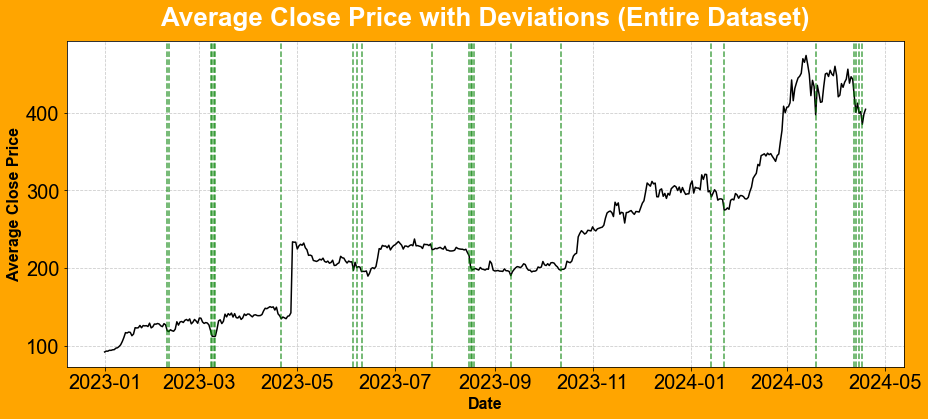
Above there’s a chart of the current deviation from daily moving averages on a normalized basis. We can see that it hit a pretty massive deviation of over -2 standard deviations from average behavior. That is usually indicative of at least a pause in the direction that the market is going.
In the equation used to calculate the chart above, we use a mix of both expansion in price, and velocity of that expansion. So we get a sense of when things are acting too abnormal from market behavior. Think about it. What do you think it’s more stable? A 100% move in a few hours , or a 100% in a few months, in a steady yet growing pace? Market volatility is usually mean-reverting.
I also have the chart above to visualize some of the historical times where that deviation was -2. In an uptrend, it’s pretty accurate to time reversals. If the market does decide to reverse the current uptrend, then the conversation is different. Right now we’ve had a few consecutive reversal signals for the past few days, let’s see how the market plays around these prices.
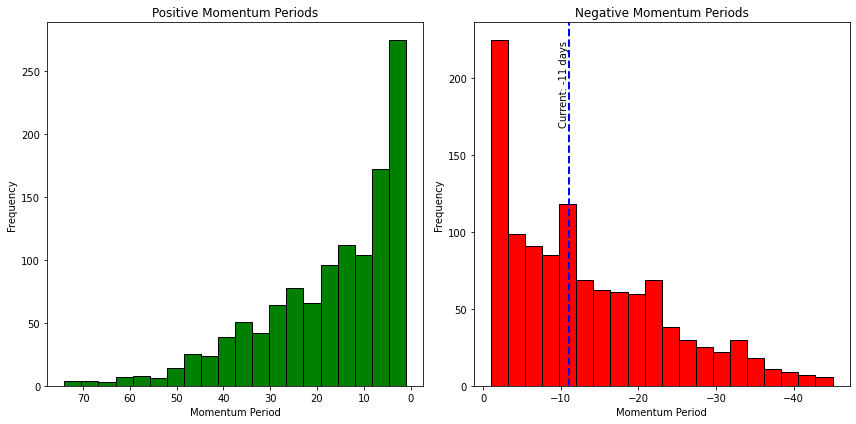
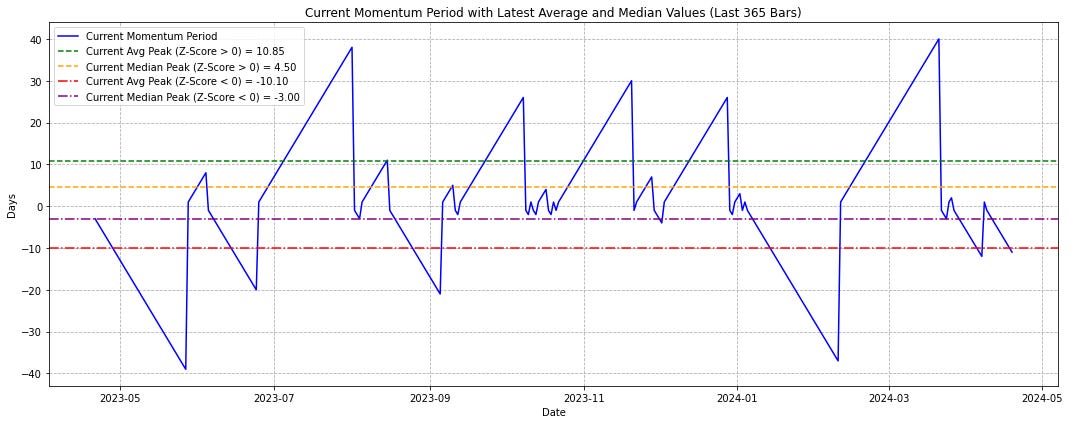
In terms of time in this negative momentum period, it hasn’t been that big of a period. The current average stands at around 10 days of negative momentum, and we’re currently sitting at 11 days of actual negative momentum. What might cause some confusion is that we had around 12 days of negative momentum in late March, that was followed by a small recovery, which reset our time in a negative period. In any case, it has been a tough few weeks, and it’s noticeable at the portfolio level.
If we take a look at how the average April performs for Bitcoin (blue), and the actual April performance of this year (red), we can see that we are having a very weak April compared to the average performance. Usually, April’s have been pretty strong in nature.
Personal Portfolio Performance
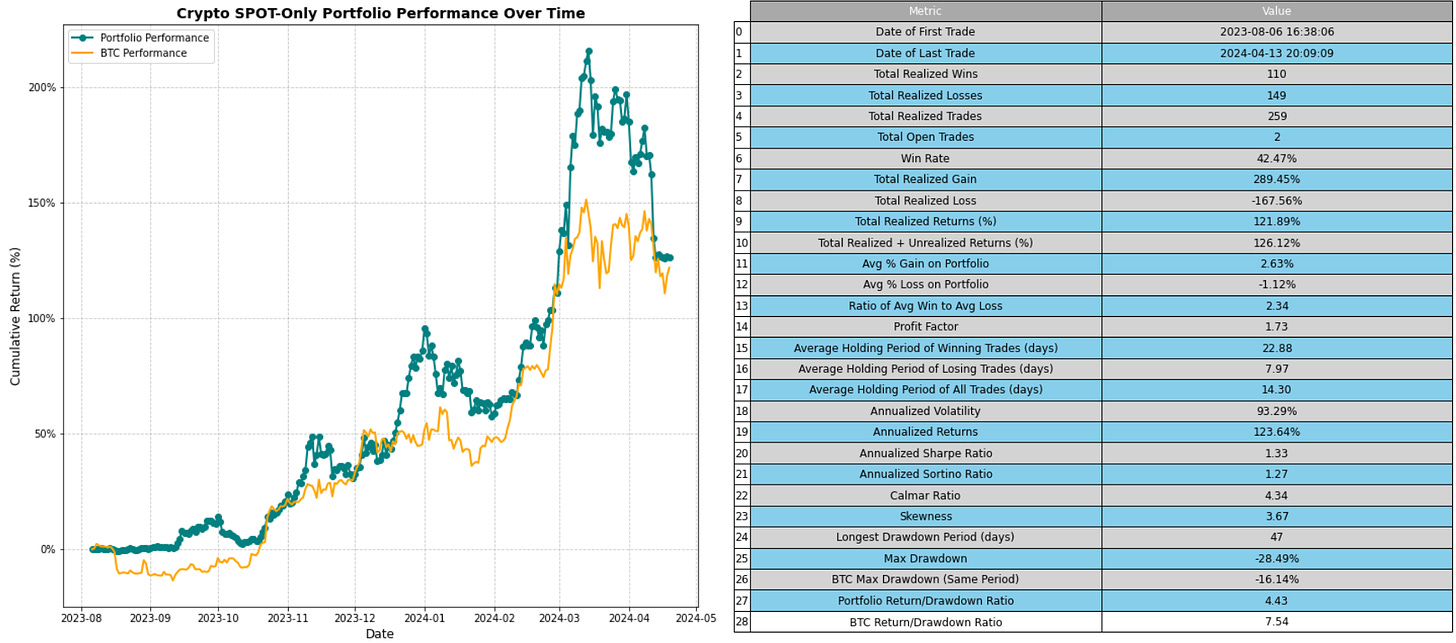
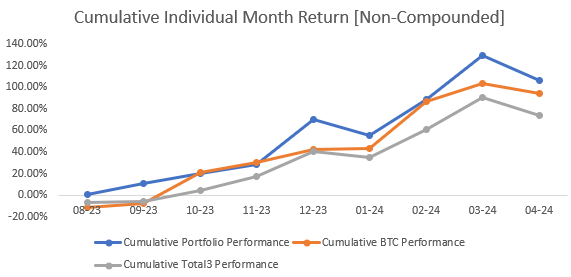
First I just want to make a disclaimer. I run my portfolio at a higher volatility than most would be able to handle. That’s why we are going to see higher returns during great periods, but also larger drawdowns during bad periods. This is fine, as long as you know the assumptions you’re making, and if you’re getting paid for that added risk.
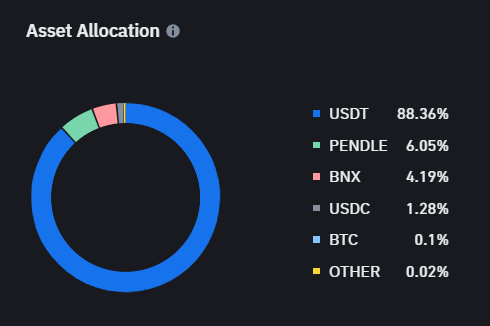
Currently I am sitting at nearly 100% stables following this 28% drawdown. There’s not much going on the market at the moment, and as a consequence I’ve had no triggers to open exposure. It’s all a waiting game now for if/when the next regime shows up, to be there, and capitalize once again on the opportunities that are presented.
Considering the current destruction in altcoins, I am quite happy about how the portfolio has performed. I’d prefer to have seen a smaller drawdown, but risk is what we get paid for. We are trading a highly volatile and dangerous sector, that will go through these wild swings from time to time. There’s not much you can do about it other than decreasing volatility, but at the same time, decreasing the return. There’s nothing wrong with that, is just an option that you must choose.
Also notice how a lot of the “traders”, that were showing profits for the past few months, aren’t anymore. Wonder why? This is a tough business, it’s very hard to be consistent over time. Many new traders that got attracted to the shiny returns that the past few months provided, are getting a taste of reality and probably blew up their portfolios. And they haven’t even gone through the worst, as I have through late 2021 and 2022.
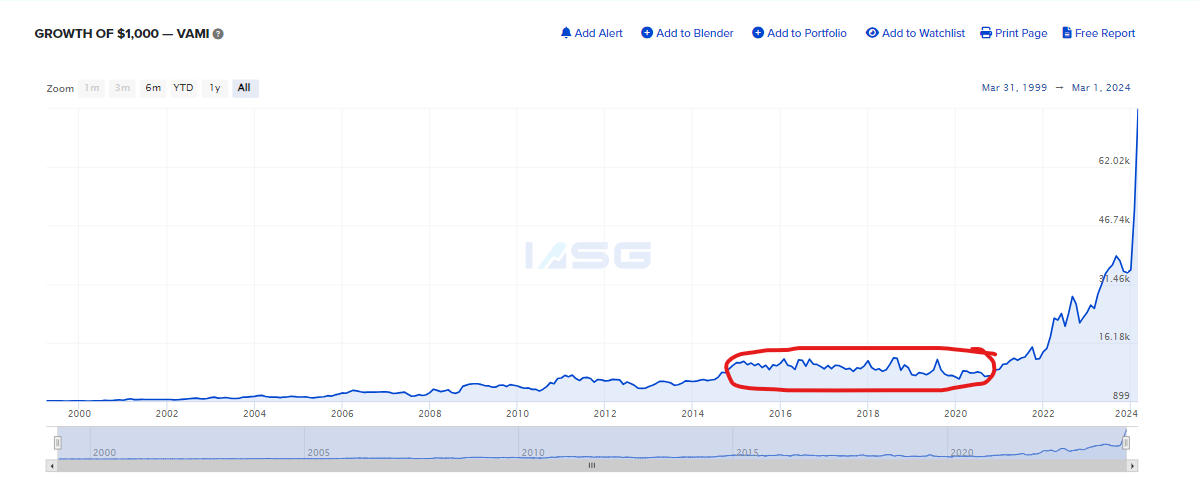
Trading is really hard as a business. There will be many months, and sometimes years where you don’t make money. Take the sample of Mulvaney Capital, that has had a huge run recently.
From 2015-2020 they made no money. How would you have reacted if your portfolio made no money for 5-6 years in a row? Sure, we are trading different markets and managing lesser capital than Mulvaney. The probability of going through this extended period of bad performance is lower. But what if we do? You must always consider risk first, rather than how much can you make. The returns will eventually come when you hit a regime where your system really shines. Until then, you must survive.
I try to keep an healthy amount in my personal finances, of a few years of expenses. This way I don’t have to be heavily dependent on the returns of any given year. I know that I will hit more periods of many months of no returns. I know that I will hit more periods of more than a year of no returns. It’s just a fact of being a trader and you must embrace that. There’s no way around it. If you want to be in this business that is my number 1 reminder for you. There’s no reward with a proportional amount of risk. Want high returns? Want returns above average? Be willing to go through above average volatility and uncertainty. Don’t try to outsmart the market, as you can’t. Focus on sensible systems, that make sense and have been proven to work elsewhere. That is your best bet. There’s no guarantees.
That’s also the purpose of this newsletter. Is to share with you the reality of being an actual trader. There’s many “traders” out there that sell services that don’t even trade themselves. You shouldn’t be learning from theorists in my opinion. Look for traders that are actually in the trenches and have been achieving what you want to achieve. Ask them questions, try to find out what they do. That’s the best way to get at the goal. I hope this helps.
If you like more content on systematic trader, consider joining our paid newsletter as that is the way I can keep sending new strategies and investing more into research. Really appreciate your support and trade safe!
Disclaimer: The content and information provided by the Trading Research Hub, including all other materials, are for educational and informational purposes only and should not be considered financial advice or a recommendation to buy or sell any type of security or investment. Always conduct your own research and consult with a licensed financial professional before making any investment decisions. Trading and investing can involve significant risk of loss, and you should understand these risks before making any financial decisions.


