Navigating the Waves of Correlation: A Dive into Pairs Trading with BTC and ETH
Exploring the statistical arbitrage opportunities between Bitcoin and Ethereum through correlation coefficients and linear regression
Introduction
In the turbulent waters of cryptocurrency trading, the journey towards discovering a semblance of predictability often leads to innovative strategies. One such strategy is pairs trading, a method rooted in the correlation between assets, making it a fitting approach to explore the relationship between popular cryptocurrencies like Bitcoin (BTC) and Ethereum (ETH). This venture not only unveils intriguing insights but also opens doors to potentially profitable trading opportunities.
Understanding Correlation
The Basics
Correlation is a statistical measure that depicts the extent of a linear relationship between two variables. In the crypto domain, understanding the correlation between assets like BTC and ETH is pivotal for a trader looking to capitalize on their price movements.
Pearson Correlation Coefficient
The Pearson correlation coefficient is a widely utilized metric to quantify the degree of correlation. Its value ranges between -1 and 1, where 1 signifies a perfect positive correlation, -1 denotes a perfect negative correlation, and 0 indicates no linear relationship. In simpler terms, a high positive Pearson coefficient reveals that the assets tend to move together, while a negative coefficient suggests they move inversely.
Dissecting Historical Correlations
Historical Data
Delving into the historical correlation between BTC and ETH, with a focus on 4-hour intervals, unveils a dynamic narrative. Unlike static relationships, the correlation between these assets ebbs and flows with market conditions.
Market Fluidity
The fluidity of markets underscores the importance of not getting anchored to past correlation data. The past is not always a precise prologue to the future, especially in the fast-evolving cryptocurrency markets.
Classifying Correlations
Bucketing Correlations
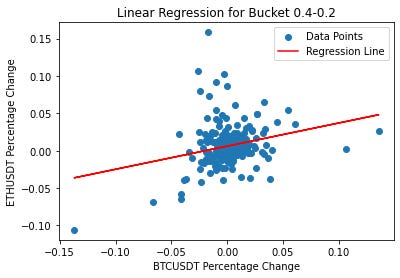
To navigate through the varying degrees of correlation, we categorize them into distinct 'buckets' based on their coefficient values. This classification sheds light on the changing nature of correlation and its impact on price movements.
R-squared Values
The R-squared values, representing the goodness of fit in our linear regression model, further elucidate the relationship between price movements and Pearson coefficients. Higher R-squared values indicate a stronger linear relationship, providing a foundation for potential trading strategies.
Uncovering Trading Opportunities
Identifying Deviations
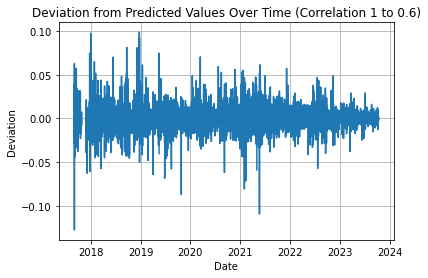
Outlier deviations within these correlation buckets are the crux of our trading opportunities. For instance, an unexpected movement in ETH's price, given BTC's movement, signifies a deviation from the norm, thus a potential trading signal.
Deviation Analysis
Analyzing these deviations, by comparing the actual percentage change of ETH to the predicted percentage change based on BTC's movement, uncovers the essence of our trading strategy.
Trading Deviations
Hypothetical Scenario
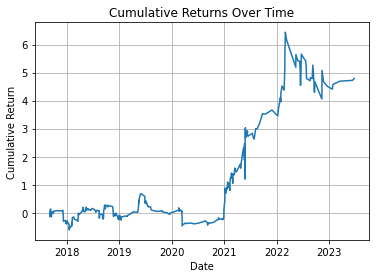
Visualizing a scenario where a -2% deviation from the predicted value transpires, we hypothesize a simple trade—buying at the close of the bar where this deviation occurs and selling 8 bars later. This scenario, albeit basic, underscores the potential strength of our signal.
Fine-tuning the Strategy
The example provided is simplistic and does not account for factors like stop losses or Take Profits (TP's). However, it paves the way for further refinement and additional filtering to enhance the strategy's efficacy.
Testing the Waters
Visualizing a scenario where a -2% deviation from the predicted value occurs, we can hypothetically buy at the close of the bar where this deviation happens and sell 8 bars later. This basic scenario, devoid of stop losses or Take Profits (TP's), exhibits the potential strength of our signal.
Expanding the Horizon
Beyond BTC and ETH
Exploring extreme deviations among a broader pool of correlated assets uncovers a realm of possibilities. By long the underperformers, we potentially unearth a more robust trading strategy.
Regime Filtering
Examining how correlations are affected in positive versus negative market regimes adds another layer of depth to our analysis. This insight can be instrumental in adapting our strategy to varying market conditions.
Conclusion
The expedition into pairs trading and statistical arbitrage within the crypto space is a complex yet rewarding endeavor. The initial exploration, focusing on BTC and ETH, serves as a stepping stone towards broader, more nuanced analysis. As we continually refine and expand our strategies, the aim is to carve out a more substantial trading edge in the tumultuous yet exhilarating cryptocurrency markets.


