My 7-Step Framework For Accurate Backtesting
Don't be mislead by bad modeling again!
Hey there, Pedma here! Welcome to this ✨ free edition ✨ of the Trading Research Hub’s Newsletter. Each week, I'll share with you a blend of market research, personal trading experiences, and practical strategies, all aimed at making the world of systematic trading more relatable and accessible.
If you’re not a subscriber, here’s what you missed this past month so far:
If you’re not yet a part of our community, subscribe to stay updated with these more of these posts, and to access all our content.
A lot of “traders” talk about backtests, and the problems inherent from doing them poorly.
But most of them never talk about ensuring they are as accurate as possible, so that when you launch them, they reflect what you modeled for.
This is because 99% of those “traders”, either never launched a model, or hide their results when they fail.
So we never read about the actual problems, once we want to take that next step, and get the model live in the market.
Why is this important?
Imagine that you build this amazing model, with a certain volatility and risk profile.
You deploy it, 6 months go by, and you get a warning in the middle of the night, saying that you got liquidated.
You have no idea why.
You jump out of bed, confused, and in shock of what just happened.
Only to figure out, that your assumptions about volatility were wrong, because you didn’t properly audit your model.
I never got liquidated like this, but I’ve gotten a few scary situations due to it.
When I first deployed a model, I had no idea about how to do a proper audit of my assumptions.
So I didn’t know if what I had modeled for, could be then translated into a real live environment.
I just trusted that the backtest reflected what I had modeled it for, and went with it.
How naive I was…
Obviously, I hit my head against the wall more time than I can remember, with that approach.
So I had to develop a method, a step-by-step framework let’s say, to ensure that I am never doing the same mistakes twice.
Today we’re going to look into my audit process in-depth.
Hopefully, if you follow it well, it will decrease the likelihood that your models have bad assumptions, before deploying them.
The model we’re using today, is a simple breakout model, just for the purposes of this test.
Let’s get into it!
Index
Introduction
Index
Step 1) Manual Check
Step 2) Signal Ranking Checks
Step 3) Realized and Unrealized Returns Check
Step 4) Contribution to Unrealized Returns by Asset
Step 5) Available Capital Checks
Step 6) Allocation per Signal Check
Step 7) Closed Trades vs Open Exposure Checks
Step 1) Manual Check
The first check is the most basic one. But because it’s basic, it doesn’t mean it lacks importance.
Actually if you get this one wrong, the entire model is wrong.
We want to compare the trades our model simulates, with the actual trades that we’d have taken, given our parameters.
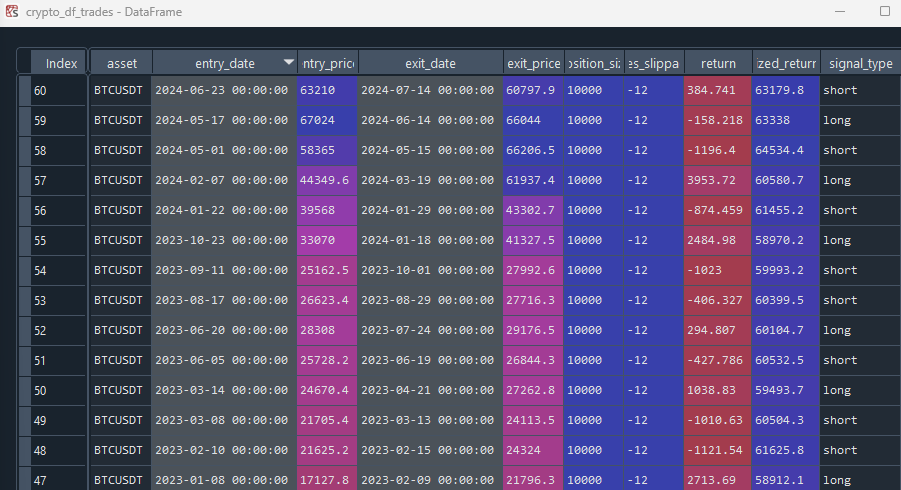
Get your trades neatly organized on a table, where you can quickly see their entry price, entry date, exit price, exit date, and simulated return.
Then simply open up a chart, and check 5-15 trades at random, to see if they match what you modeled for.
Add some variability between longs and shorts.
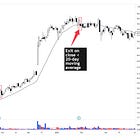
For example the trade above perfectly matches what I modeled it for.
If you have a detailed eye, you can see that a few days prior to the exit, on the 11th, it seems that we get an exit signal.
I also thought something was wrong, but no, the bar never closed below the previous lowest low, only by a few dollars, hard to notice by looking at it.
So it’s correct.
We do this process at least 5-15 more times, completely at random, different variations, and we move forward.
This gets our basis that the signal is being accurately calculated.
Step 2) Signal Ranking Checks
This is all fun and games when we are trading only 1 asset, but what if we’re trading a larger universe, and choosing between signals using some ranking model?
Let’s say you get 20 signals in a single day, which is normal depending on the model, but you only have available exposure for 10 of them.
How do you pick them?
You rank them by some feature, that you think gives them a higher chance of working out.
This is built at the backtest level and you need to know what kind of signals add some predictability to your model.
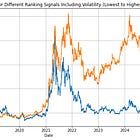
Here’s an article I wrote on that:
How do we know we are picking the ones according to our ranking feature, and not others by mistake?
That’s a great question, that also needs to be looked into.
If you’re going to trade a multi-asset portfolio, you need to know at all times, what assets are being chosen and why.
I like to keep them organized inside a dictionary , by each date.
When I open a specific day, I can quickly see which ones are in there, their rankings, and if it makes sense the ones we picked.
Here the ranking is merely volume, from highest to lowest, and you can see that they are properly ranked.
We can then go to the chart, or to an excel spreadsheet, and make independent calculations, to understand whether the ranking features are also accurate.
In our example the ranking is merely volume, so you check on the chart if the volume matches what you have in your ranking.
Check 5-15 days of signals, and make sure that the chosen signals, are correct with how you modeled it for.
Step 3) Realized and Unrealized Returns Check
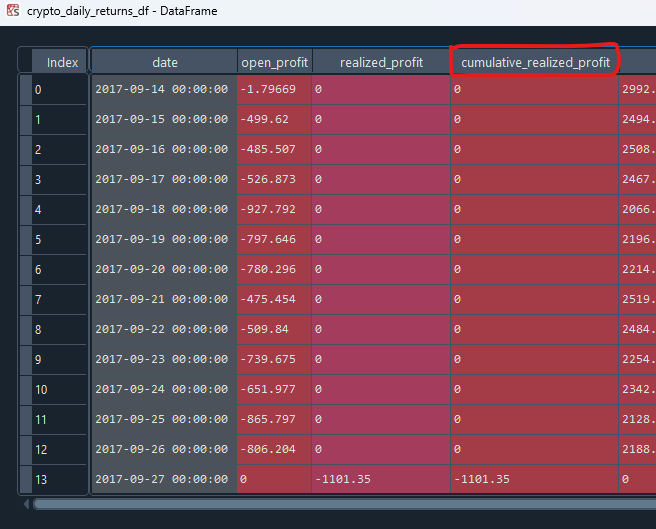
In order to properly measure the volatility of your model, you need to understand what is the distribution of both realized and unrealized returns, on a daily basis.
Once again, I say daily because I trade low frequency models, the higher frequency you trade, the more you need for regular checks.
In order to do this, we have to group all of our returns into daily buckets.
We add the realized returns portion, and roll them forward.
Then we add our unrealized profits, on that given day, but we don’t roll them forward.
Why?
Because they haven’t been realized. And since they are being calculated from their initial entry price, we don’t want to be rolling the same return forward.
The unrealized returns add their weight and fluctuations to the daily equity, but are not permanent until we realize them.
You just want to know that today you have X unrealized returns, and Y cumulative realized returns.
And then you add the cumulative realized returns, to the unrealized returns of that day, and the initial capital, to get the total equity you have available.
It might seem complicated, but don’t skip this step, it’s very important you get this right.
If you don’t know how much capital you have available, how can you properly allocate between signals?
I keep it in a dictionary, as it is easier for me to check, with all the individual trades that are open on any given day.
If after this article you’re still unsure about whether your trading/investing model is accurate, or has good chances of working in the market, and want to have my own custom assistance.
We help individuals and enterprises, implement and deploy strategy portfolios, tailored to their specific needs.
If you want to discuss the possibility of working with me:
Step 4) Contribution to Unrealized Returns by Asset
Now that we know our returns on a daily basis, we want to know what is the unrealized return contribution, of each individual asset, to the overall equity on any given day.
Why do we want to know that?
How else can you know, that the returns you assumed for each asset position, is being accurately calculated, and contributing fairly to the overall equity?
There’s so many problems that can happen in between, and you need to know how each individual trade is affecting the overall portfolio.
Here’s the open position dictionary.
Each key represents a day, and inside each key there’s the complete inventory of open trades.
If we have a question about a specific trade, we can just open the trade, and see what’s inside.
And here it is.
You can measure if the open returns are accurate, if the signal type is accurate, all kinds of metrics.
All of this because you have it organized inside each day!
Here’s a perfect example of why we need this.
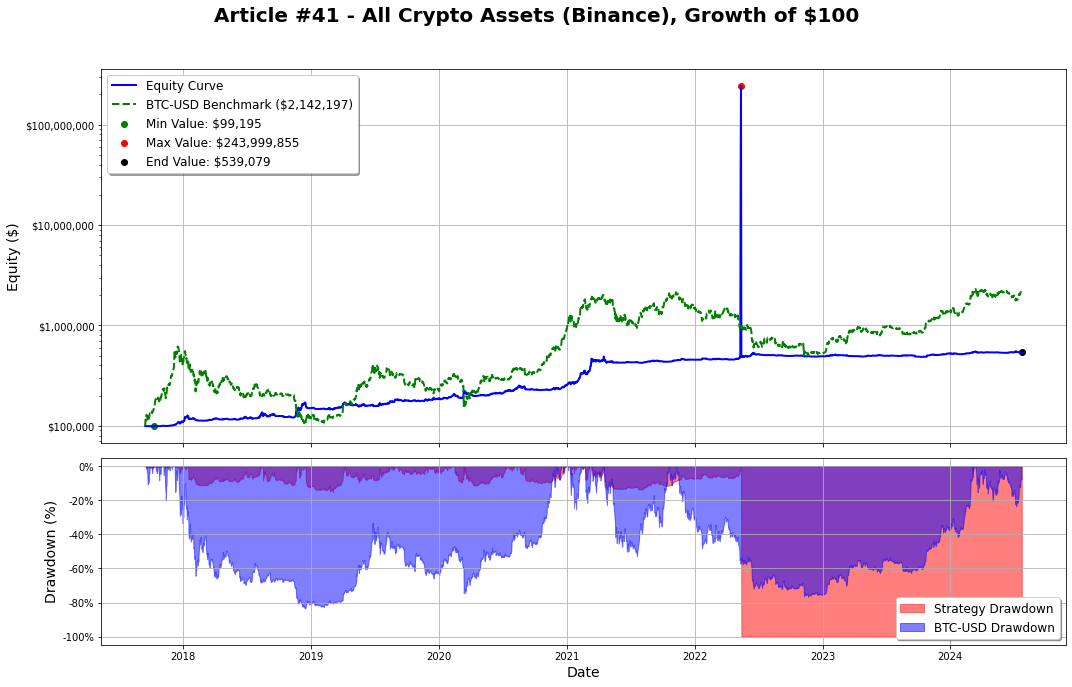
Look at that spike in unrealized returns around March/April 2022.
If we don’t have this check we wouldn’t ever know.
And that completely skews the performance of our model. Imagine how much volatility has changed, when the model factors in that random >100x spike on a given day.
Let’s use our new method to find out what went wrong.
First we need to check the specific day where this went wrong.
We can check from our table above, where we have realized and unrealized returns.
We find that the problem is around the 12th of May 2022.
Now we go to our open positions table on that day, and we find out what is skewing our results there.
We find out that LUNA is the one skewing our results.
After some investigation, I find that the calculations for returns on the short side, is wrong.
And that is why it’s skewing the results for this trade.
This is the importance of audits. Small things have an heavy impact on your models.
And just like that, we fixed it.
Let’s check back our LUNA example.
And now we have the proper return for the short position.
Step 5) Available Capital Checks
The next thing we want to do, is to understand if the available capital that we have on any given day, to allocate to our signals, is correct.
You have to subtract the capital you use to add new trades to the portfolio, and add the capital from positions that you close.
Make sure that the capital used, is the initial capital you opened the position with, because the unrealized capital is irrelevant to how we open positions.
And the frequency on that is completely dependent on your model.
If you’re trading a hourly model, you need to do more checks.
Since I only trade daily or above, I only check it on a daily basis.
The process is the same , it just requires a different time window, depending on the scale of your strategy.
I want to know, on any given day, how much equity I have.
This is in function of:
Initial Capital
Realized Returns (depending if you compound or not)
Since we’ve already done the proper checks on our initial 4 steps, when you sum this together, they should give you the accurate representation of the total available realized capital on any given day.
Why is this important?
If we’re going to allocate capital to signals, we need an accurate tracking of that capital.
Step 6) Allocation per Signal Check
This step is where it gets tricky.
Because there’s a lot that will affect the accuracy of this step.
Your Capital and Risk Management Strategy
Realized Returns
Initial Capital
Total Equity at Signal Time
If you did the proper checks prior, all of them should be in line.
You need to ensure that you did the proper work here. It’s imperative that everything is as accurate as possible, otherwise you’ll have bad assumptions about position sizes.
We go back to our open_positions dictionary, from step 4, and we check the position size we allocated to each trade.
In this case we allocated $2691.98.
Why?
Because it is in function of the annualized volatility.
But it is also in function of how much capital we had at this time (REALIZED).
Let’s get all this information.
First thing we need, is total capital available prior to the entry date.
We go to our daily returns table from step 5, and get that information, for the 6th of May 2024.
Here it is.
So let’s break down the calculation.
Available Equity (non-compounded test): $100,000
Annualized Volatility at Entry Date: 0.7429
Target Volatility: 0.40
Max Positions Open per Day: 20
Compound: False
Formula for Position Size: (Target Volatility / Max Positions Open per Day) / Annualized Volatility * Total Portfolio Size
Calculation for Position Size: (0.4 / 20) / 0.7429 * 100000 = 2,692.15
And there you go, the position size is correct. (approximations change a few cents)
If we compounded, we’d use the REALIZED available equity instead.
Step 7) Closed Trades vs Open Exposure Checks
What do I mean here?
We need to have 2 performance tables:
Trades on a realized basis. Here are some of the columns:
Entry date
Entry price
Exit date
Exit price
Return
Cumulative Return
Daily realized and unrealized returns.
The first table is pretty straightforward, everyone’s familiar with it.
You’re basically looking at the trades you have, on a realized basis, rather than looking at open exposure.
The second table, is used to measure the unrealized returns, plus the realized returns of your strategy, on any given day.
Why is that?
Because you want to know the TRUE volatility of your model on an unrealized basis also.
Picture this.
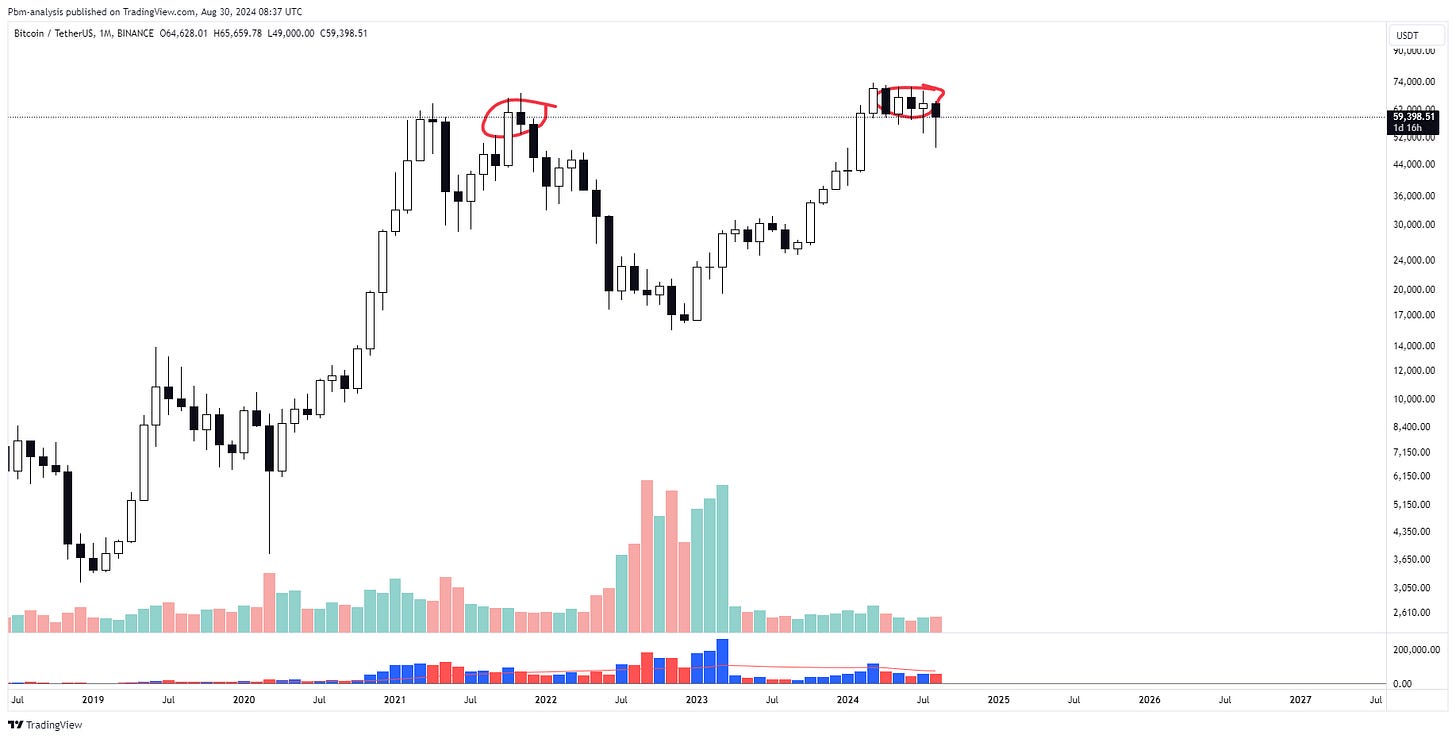
In 2021, you get excited about the crypto market, everyone’s talking about it, it’s on every ad, etc.
Being the savvy investor that we all are, we go ahead an place a position, with a substantial amount of our net worth.
The following months the market crashes…. obviously…
Then we hold on until 2024, and we’re back in profit.
Now we get scared and we sell for a small profit!
We look at our sheet, and we made money on the trade, because we entered at 59k, and exited at 60k!
Yay we are great traders.
The problem is, someone that is looking just at that table, wasn’t able to factor in the 80%+ drawdown, that we just took, and don’t know the true risk profile of the trade.
So we always have to measure performance, on a frequency that is suitable to our models.
Since I trade daily models, I check my exposure on a daily basis.
But this gives us another powerful reconciliation tool.
If you have daily exposure performance, and closed trades performance, you can now pair each other, to find if there’s a discrepancy between them.
Normally they have to match at the end of a period right?
First we get the total cumulative daily returns of the model.
We go back to our step 5 table where we have our daily returns.
We look at the last time we realized a profit and that was on the 21st of July 2024, and our equity was $408,314.
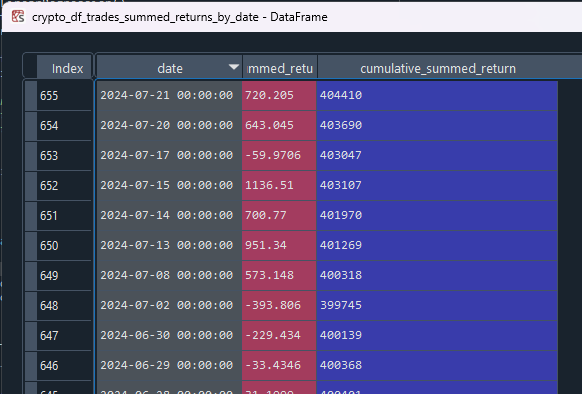
Does our closed trades dataframe tell us the same? Let’s find out by summing the closed trades returns by day.
We can see that our cumulative realized returns is $404,410 and the unrealized returns on that day was of $3,904.42.
And that gives us the total equity of $408,314 , from 2 completely different sources of calculation.
Now we have better chances that our models truly represent the risk profile of our models. 😊
At least on the model part.
The future is a whole different conversation for another day!
Hope you’ve enjoyed this.
If you want to discuss the possibility of working with me:
Disclaimer: The content and information provided by the Trading Research Hub, including all other materials, are for educational and informational purposes only and should not be considered financial advice or a recommendation to buy or sell any type of security or investment. Always conduct your own research and consult with a licensed financial professional before making any investment decisions. Trading and investing can involve significant risk of loss, and you should understand these risks before making any financial decisions.


