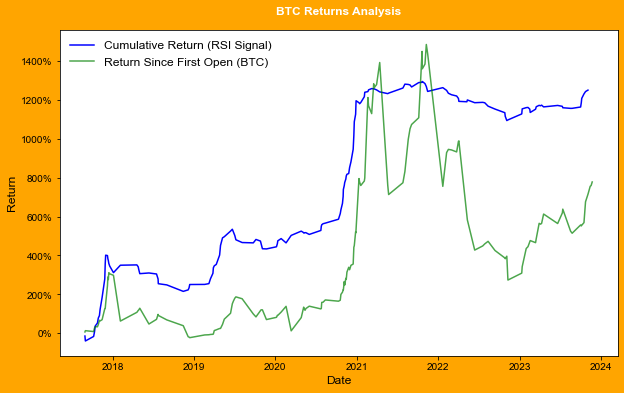
Measuring RSI as a Momentum Signal for a Crypto Model
How Relevant is the RSI as a Momentum Signal on Bitcoin and other Altcoins?
Summary of Contents
Introduction
The Relative Strength Index (RSI) is frequently misused by inexperienced traders.
Emphasis on avoiding categorizing these individuals as professional traders/investors.
RSI's Purpose and Calculation
Used to gauge market momentum and trends.
Calculated using average price gains and losses over typically 14 periods.
Scaled between 0 and 100.
Measuring Validity of RSI Signals
Common misconceptions about buying/selling based on RSI without understanding underlying principles.
Introduction of "buckets" to better analyze RSI values.
Bucket System for RSI
Bucket 1 (0-20): Strong selling pressure, potential for price reversal.
Bucket 2 (20-40): Undervalued condition, possible bullish reversal.
Bucket 3 (40-60): Neutral area, balance between buyers and sellers.
Bucket 4 (60-80): Overvalued condition, possibility of bearish reversal.
Bucket 5 (80-100): Strong buying pressure, potential for price peak or reversal.
Application on Top 50 Assets on Binance
Allocation of RSI values into buckets.
Most occurrences by bucket.
Analysis of Signals from Buckets
Contrary to popular belief, higher returns often seen in higher RSI buckets.
Study of median returns to avoid skew by outliers.
Top performing buckets indicate strength tends to persist.
Longevity of Signals
Signal strength decays after around X days.
Positive skew observed in the signals, useful for strategy building.
Data Visualization
Histograms showing skew towards right, indicating more frequent gains than losses.
Conclusion
Importance of testing assumptions in trading.
Understanding the market and making informed decisions based on analysis.


