Designing a Simple Crypto Price Data Dashboard
Building a multi-strategy portfolio from scratch - Day 1
👋 Hey, Pedma here! Welcome to this✨ free edition ✨ of Trading Research Hub’s Newsletter. Each week, I release a new research article with trading strategies, code, and much more.
Subscribe to get access to these posts, and every post.
Have you ever considered building a multi-strategy portfolio, and you don’t even know where to start?
Well, I’ve never seen anyone do it publicly, so why not do it myself?
There’s a few motivations for me to do this:
I am a systematic trader, but I manually execute my main model, where the bulk of my capital is. Since I am trading a weekly system, it has been fairly low effort to do it, so I didn’t bother automating it. But now let’s change that.
Documenting my thinking today, so that in a few years, I can come back and read what my beliefs are today. One of the things I regret is not documenting more of the journey.
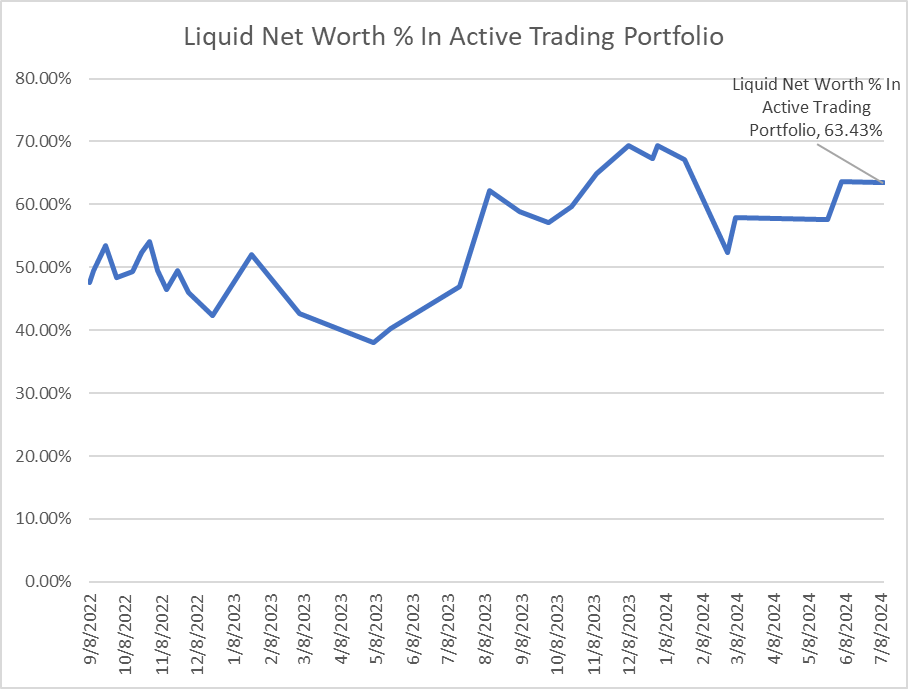
I want to share with you what it’s like to be a practitioner of the game. I am not merely a theorist doing research, I actually have capital at stake behind my models. I’ve shared publicly multiple times that over 60%> of my net worth is in my portfolios.
I want to convert more of you to the paid side of the newsletter. I feel that if I provide you with more free value upfront, you will be motivated to boost your trading resources, by reading the research I regularly share to our paid subscribers.
Awesome, we’re clear on motivations, lets drive forward!
After we are done building the necessary infrastructure, we will be deploying models that have been released in our regular research articles (join us for access!).
The goal is to manage multiple trading strategies from this dashboard. That is not only feasible, but also desirable. Diversification is an important step towards more stable capital growth.
Here’s a screenshot of what we’ve achieved today:
The purpose is not beauty right now, it’s to get things operational. Far too much time is spent on making things visually appealing, without making the backend as robust as possible. Think about backend first, and then we worry about frontend!
I want to make the disclaimer that these articles, won’t win any awards for their technical rigor, when it comes to IT or software development.
I don’t have a background in IT, software development or anything related. I build trading strategies and deploy them. If some technical terms are incorrect, feel free to point that out to me, that’s how I learn, but keep in mind that there’s much more advanced people than I, in the IT world.
I build trading models, that’s my focus.
Index
Introduction
Index
Storing data
Improving Efficiency
Storing Data
The first thing we need to do is decide what kind of frameworks we want to use in order to do this. I am going to start by using flask. Flask is used for developing web applications in python, and it’s very simple to use, that’s why I like it.
We will be using SQLite to store the data that we extract from the exchanges and go from there.
The first thing we want to do is to create a dashboard where we can look into the backtested results of our trading strategies.
Let’s begin by building out the infrastructure behind the storage of our data.
Our data will be stored in the following ways:
By asset class (crypto, equities, commodities, etc)
By individual asset
By timeframe
This way in the future, we will be able to pull any data that we want, with quite decent granularity.
This is how it looks on the folder:
I’ve made it dynamic so that when a new market is added, it won’t require additional logic to store it. All the data must be stored in the same format for future usage.
Even though we will start with a simple strategy, on a single asset class, we want to build our infrastructure, thinking about future expansion. It’s way harder to go back and change the entire logic in the future, than start with that logic already built in, even if it’s a bit more work.
After that we have to fill in the tables right?
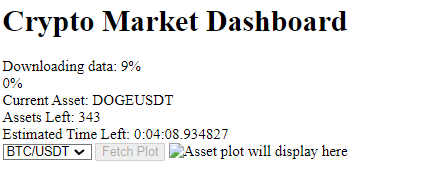
So now I’ve made the app extract data when we open the dashboard, give us a feedback on how long until completion, what assets is it extracting data for, etc.
After it’s completed, we’ll be able to look at the data from the assets we’ve extracted. We don’t want to be extracting new data, when that data is already stored. For example if we extract data today, and then later during the day we extract again, we don’t want to be repeating that over and over. If the data is already maxed out, we skip that step. I’ve built in a confirmation function for this.
Improving Efficiency
There’s another thing that doesn’t make sense. I don’t want it to extract data every time we enter the app!! I want to be able to decide when we do data checks, for efficiency purposes.
Done!
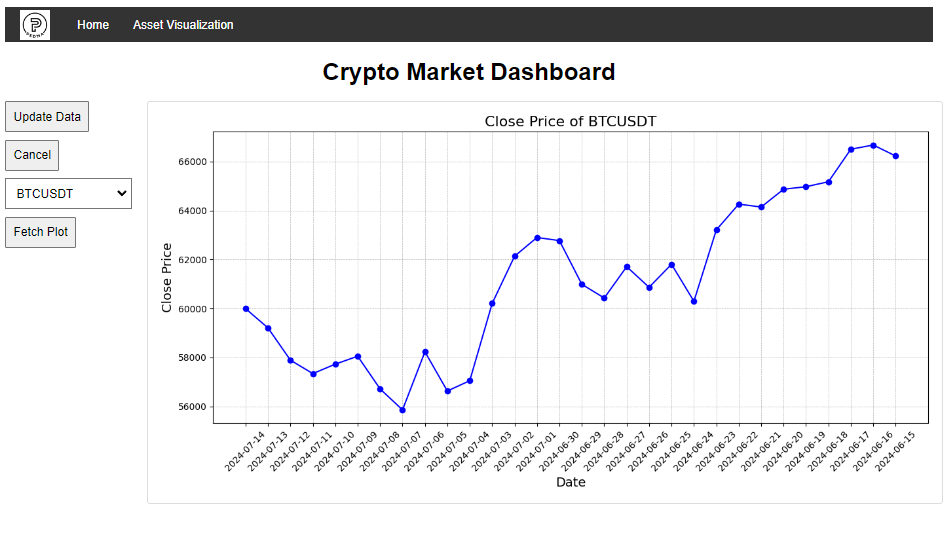
Ok it’s getting better. Let’s be a bit more picky and add a few more things, to make it more visually appealing (even thought that’s not our immediate goal). We will center the title, add a few tabs on top for other pages, add some more visuals to aid with what’s going on, and we go from there. This will be our control center, so let’s make it appropriate.
Now when we click update, it tells us how much time is left, how many assets, etc. It’s always a good thing that we display as much information as possible, about what’s going on, in the background. It will make it far easier to debug in the future.
And here we go!
We’ve also added some branding to the page!
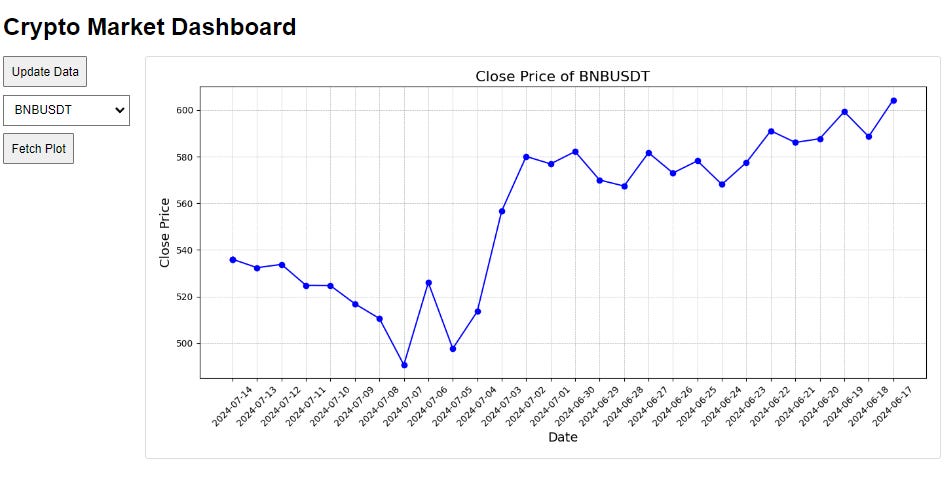
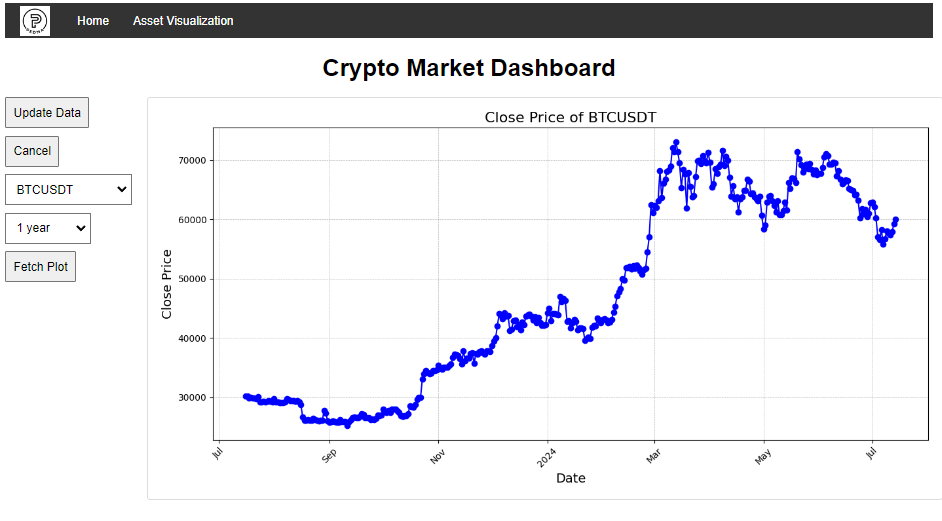
Now, let’s make it a little bit better by adding as an user input, how much data we can see, on the chart.
Now what do we want more? We can do a lot, as I think through it, a thousand ideas come to mind, but we need to remain focused on our targets!! We want to deploy a model as fast as possible. That’s the goal.
Let’s now divide our data by exchanges and by type. We don’t want to just have data from Binance, as we’ll be deploying our models on multiple exchanges, and possibly different brokers in the future. But we need Binance data for backteting purposes, because they tend to have much more history. We will also be merging multiple exchanges for more accurate reflection of what’s going on. But that’s for future articles.
Let’s keep moving!
Here we go. We are now extracting data by data type. Pretty cool ey? Let’s make it look a bit better.
Decent improvement on the visuals. I am happy about it and I think that that’s enough, on the beauty side of things. I am more worried about the operational side.
Ok we’ll take a pause for now. Email getting a bit extended and I don’t want you to get bored. Over the next few weeks, we will be building this together, so emails will be more frequent.
Good progress today everyone!!
Next week, we’ll be adding a new section with actual trading backtests we’ve released here on the newsletter. That will be a bit more complex, but once its done, we can add virtually anything to it. Eventually, we should be able to just plug them in to an exchange, directly from this dashboard manager. Pretty cool yeh?
I hope you’ve enjoyed this short article, and join us on this journey :) .
Disclaimer: The content and information provided by the Trading Research Hub, including all other materials, are for educational and informational purposes only and should not be considered financial advice or a recommendation to buy or sell any type of security or investment. Always conduct your own research and consult with a licensed financial professional before making any investment decisions. Trading and investing can involve significant risk of loss, and you should understand these risks before making any financial decisions.






Loved the idea! Eager to see where the journey will lead us!
Cheers!
Hey Pedma. Thank you for this article, but any way we can access the code to this project as well? Thanks again mate for the material.