Daily Crypto Report - 11/24/2023
Comprehensive Daily Report: Analyzing Crypto Sentiment, Strategic Portfolio Allocations, and Key Risk Factors
Introduction
Good Afternoon!
As a trader, every morning and at the end of the day I ran a few scans of the market to know what’s going on. I’ve never gotten them into written format, but a lot of people have been asking me for it, so I’ve decided to start this newsletter.
These reports take me a lot of time to produce and so I’ve decided to only release them to our paid newsletter members. I want to put my maximum effort into giving as much value as I can. I aim to do one scanner report every day, reporting everything I see in the market, as I do for myself.
However I do understand that you might not be familiar with my work, so I’ll open one of these to the public every week. Here goes this weeks free report. Let me know what I can improve!
If you’d like to support my work, and get access to the newsletter on a daily basis, consider subscribing:
Update on my Own Portfolio Allocations
Current Exposure Status
Summary
Potential New Trades For my Portfolio
Market Scanning
Commentary on Potential Trades
Sentiment and Momentum report
Percentage of coins above their moving averages
Measurement of Current Momentum Extension
Analysis of Bitcoin and Alts performance
Seasonality Charts
Overview of the most relevant news in the crypto sector (if there’s any)
Update on my Own Portfolio Allocations
My spot portfolio keeps steadily growing. We’ve had this phase where the market is stalling in terms of momentum and so we’re currently going through a bit of a drawdown from the highest cumulative return point. It’s normal and expected, there’s no returns without exposure, and with exposure comes risk. That’s the price we pay to be able to be exposed to periods of exponential growth.
I cannot emphasize enough the importance of accepting drawdowns. They are inevitable. They will always be there as long as you participate in markets. You can either accept them and learn to manage them, or don’t participate if you can’t stomach them. It’s a tough business, and those that claim an easy road are always, without exception, trying to sell you something.
Commentary on Today’s Most Interesting Position in my Portfolio
SEI is one of the most interesting positions in my portfolio at the moment. Started off as rather weak and I didn’t have much expectations for it. Most of my trades do end up as losses or tiny gains. So I am used to take losses and being wrong on these models. So it’s nice to see it gain a nice bid and start to take off. Obviously we never know where these things will land, and they can still end up being a loss despite a nice move up.
My models focus on buying assets that exhibit strong breakouts on a strong market. It’s hard to buy breakouts when you are trying to buy them on a 4h timeframe going through a multi-year bear market. The key is in smoothing signal, and managing risk in markets that were not conducive to risk.
My Current Portfolio Exposure
Stables: 42.63%
SEI: 9.75%
SEI has surpassed the current % of allocation of BTC. If you noticed from previous scanners, BTC was the highest allocation in terms of % of portfolio. As SEI grows, it has surpassed BTC and is now the largest one.
BTC: 9.48%
Bitcoin is still one of the top allocations. We are almost breaking into new month highs and it’s looking good. I still have some concerns around how extended we are in higher timeframe charts but I will let the market dictate my positioning and not my opinion. Let the models behave and have a macro perspective on performance.
RNDR: 6.42%
RNDR has been lagging a bit behind other allocations I have, which is not a problem for the model but it is not the largest gainer I have. Still decent allocation but nothing spectacular from a return standpoint. It does have a really beautiful weekly chart from a trend perspective.
PNT: 6.14%
PNT is one of the weakest positions at the moment, but nonetheless a position. We will have to wait and see how this one plays out.
Sentiment and Momentum Report
We are seeing a massive increase on coins above their moving averages. I notice that both on this data and also my portfolio as it is allocated to multiple altcoins. This is good sentiment in the market and follows what we’ve been having for the past couple of weeks and months.
As a momentum trader, this is exactly the kind of environment I want to see to exponentially build up my portfolio. If I am not doing well in an environment like this, with a system that was built for momentum and trend, then something is wrong.
I don’t measure my performance by how I performed this month, I measure my performance by how much my system is able to capture from the regime I built it for. If we are in a momentum regime, and my momentum system is struggling, then something is wrong with the model. Usually it’s hard to do a bad job in a strong momentum environment, the hard part comes after when that regime shifts and we need to get defensive. That’s where the real money is, in the way you defend the gains you’ve previously built.
If we take a look at our rolling daily deviations from the moving averages, we can see that we are not too deviated to the upside, which is a good incentive to add exposure. I don’t like to add exposure when the market is too extended to the upside. Extensions are hard to measure but I think we do a decent job with our models. Obviously they will be wrong a lot, but like anything in the markets, we use it for what it is, a mere guide.
I prefer adding exposure when the risk reward is there, and that is when prices reset and are ready for continuation. If we are buying positions into extended moves, we can’t expect that those positions give us as much returns as taking a position from an early start of a trend. Of course there’s always a caveat in anything related to markets. In regimes like 2020-2021, it’s imperative we keep adding exposure on the uptrend, even if it’s too deviated from means. This is why we use a rolling approach to calculate average behavior, so that it adapts to the current environment and is not skewed by historical irrelevant data.
Each of the vertical lines on this chart represent a time where the standard deviation, of our normalized deviations from the mean (previous chart), was above 2. This can help us identify spots where price can become unstable due to abnormal deviations from averages. The nuance here is that we have to be aware when we are leaving a consolidation and so a very large outburst might not be normal and trigger our model too early. All of these analysis need to be taken into consideration as an aggregate and evaluated in the current context we are in.
Blue: Normalized deviation above the 20SMA >2
Green: Normalized deviation above the 50SMA >2
Red: Normalized deviation above the 200SMA >2
ALTS and Bitcoin relative performance to each other remain rather close. The axis are different as there’s obvious differences in volatility on both price series. But I like to put them together to get a perspective of their path of performance. It gives me a better perspective into relative strength/weakness between both.
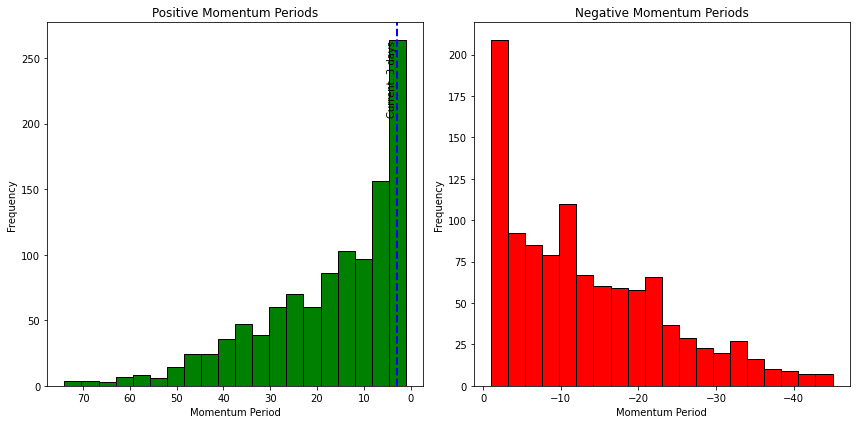
We are currently at 3 days of positive momentum according to how I define momentum in my models. We are still in a zone that any forecast into the future is rather random and with a small degree of confidence. If we progress into the future, the odds of persistence will increase according to historical periods of momentum.
This makes logical sense because more momentum means that more people will be buying into the move. One of the core principles about trend and auto-correlation that we find in price series. People like to start buying when they see things moving a lot and feel “safe”, and also when they start being mentioned around social media.
Right now we stay rather defensive with our forecasts and will wait a few more days before thinking overly positively about short-term future momentum.
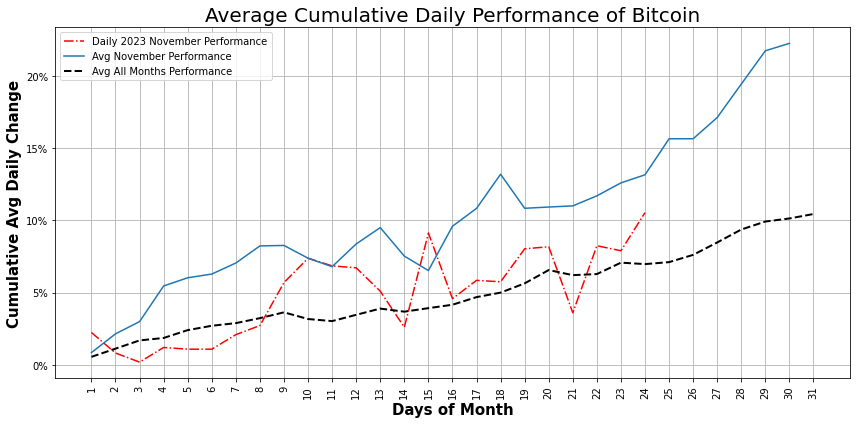
From a seasonal standpoint, November performance of Bitcoin remains rather weak compared to historical averages. These averages can be skewed by large outlier months in the past, we will have to investigate that in a future article. For now we know we are above average performance of ALL months, but below performance of all Novembers.
Potential New Positions For my Portfolio
There’s a few positions I am looking to add if/when they get a trigger.
RAY is a pretty strong chart that I am looking to add if we get a continuation here. It meets all of the criteria of my models, and now we just need to wait to get that trigger that gets us in the trade.
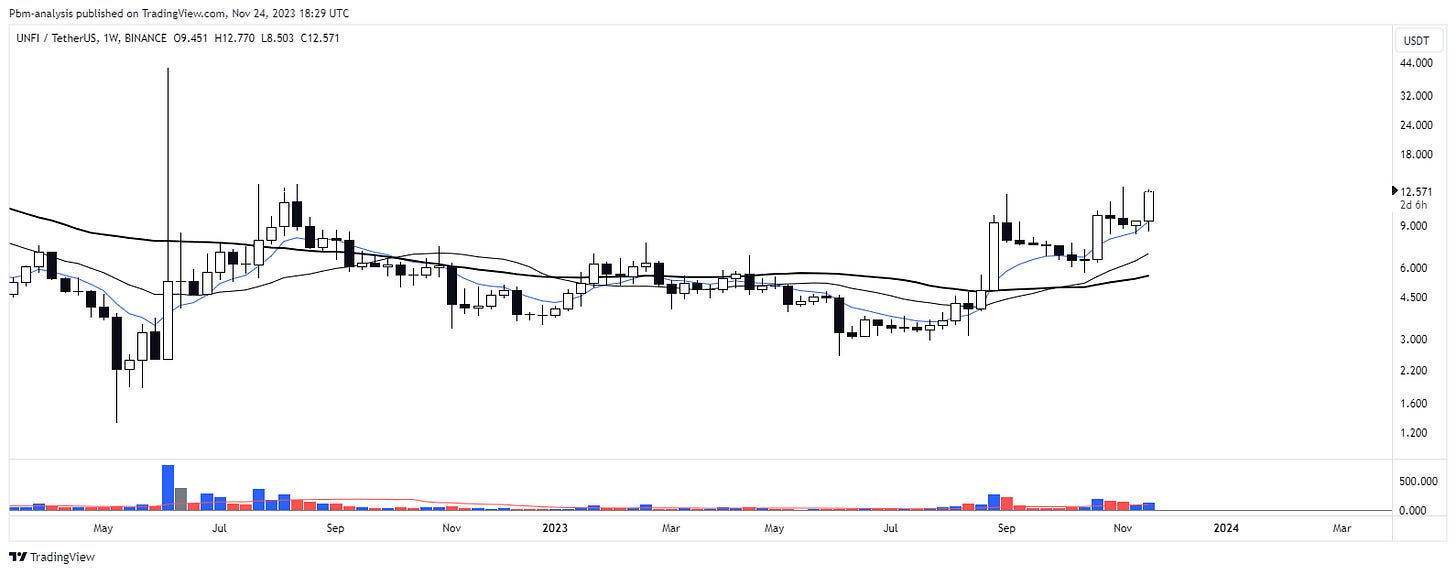
UNFI is another strong chart, that has been quite a decent performer this year. It has built this base and is ready to give us a trigger.
DYDX is another chart that has been very strong and that I am actively monitoring for a position.
SUI not the strongest, but definitely meets all of the criteria I look for.
OP also on the list. A previously strong perform back in 2022. Anyone that was around the crypto sector around that time knows about OP. Looking actively to see if we get a breakout to add to my portfolio exposure.
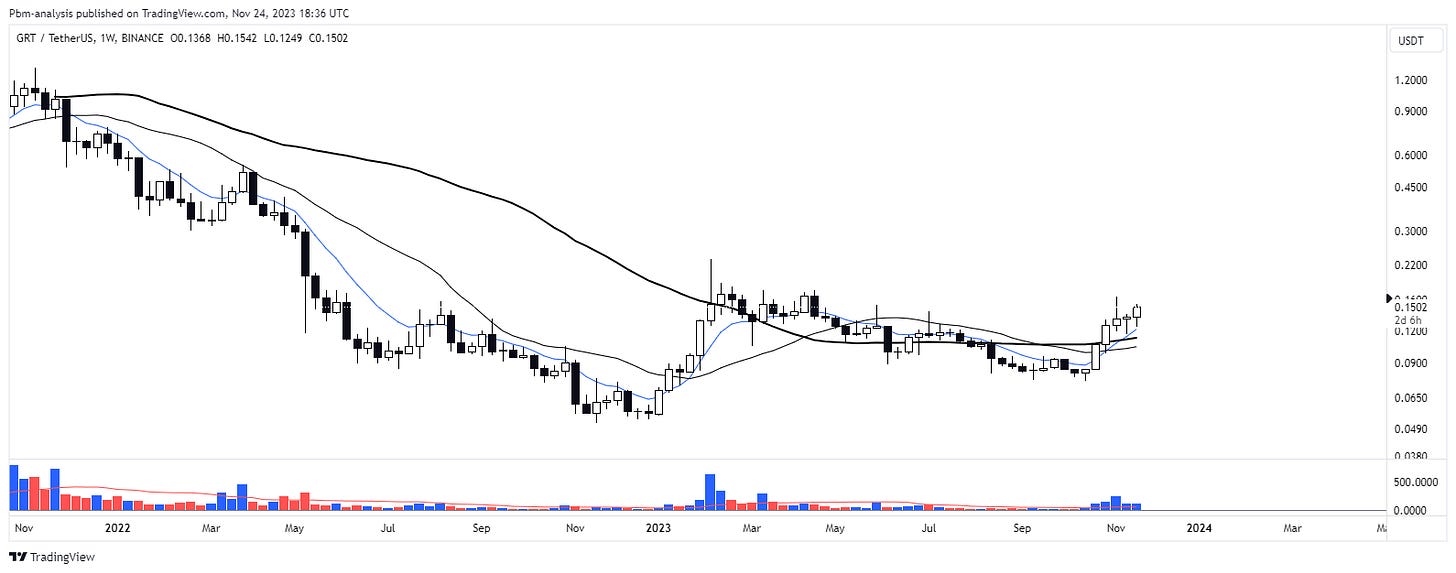
GRT is another strong performer with potential upside if we get a continuation trigger.
Closing Remarks
My confidence in this market is rather neutral, I see some strong deviations that have not yet been corrected but that are present. I’d like to see a further dip or stabilization before we see another leg up but that is only my discretionary opinion. I leave everything to the model I’ve built and I don’t interfere in that, I’ve built it for a reason.


