Building a Backtesting Tab
Building a multi-strategy portfolio from scratch - Day 2
👋 Hey, Pedma here! Welcome to this✨ free edition ✨ of Trading Research Hub’s Newsletter. Each week, I release a new research article with trading strategies, code, and much more.
Subscribe to get access to these posts, and every post.
Hi everyone, I hope you’re enjoying these series on building a trading model from scratch!
At the end of the day, the purpose of this project is to show you that even someone like me, with 0 coding background, can develop, deploy, and operate an automated strategy portfolio into the live market.
This has taken many years to develop though. It’s not like I am doing this for the first time. I went down every pitfall that you can think of and lost a lot of money in the process.
It takes work, but it’s possible, and once it’s built, all you have to do is regular checks and let it trade.
No more emotional biases that get in the way of a manual trader. (Unless you interfere with the model of course)
In the previous article on our series of going from nothing to a deployed strategy portfolio, we got a simple dashboard to plot the closing prices of our assets of choice, by exchange and by type.
If you didn’t read that article, here’s the link:
Even though this is cool, and we don’t have to rely on external services for pricing, this is not really the point is it?
We want to make strategy deployment efficient, from model, directly to production. Our next step will be to build a page where we can test our models and look at their performance.
Why do we need this?
Because once the strategy is deployed live, we want to be doing active comparisons of modeled execution vs live execution. One of the few things we are 100% sure about in trading, is that trading costs money. Every trade we take, we start from a negative position.
If we overlook the weight that these costs have in our trading, we might be trading a model that is not what we expected to be. So we need to be very careful and thoughtful about how we model for these things. Real live environments are much different from safe and controlled environments.
Things will break all the time, trades will be missed because of errors with the exchange, costs will add up during high volatility environments. It’s a chaotic business. And execution plays a MAJOR role in it.
This is what we achieved , by the end of today’s article:
So let’s start our article!
Index
Introduction
Index
Plotting Orders on a Chart
Single-Strategy Backtesting
Adding Features to the Backtesting Tab
Fixing Strategy Results
Next Steps
Want to have my own custom assistance, with your systematic trading business?
We help individuals and enterprises, implement and deploy strategy portfolios, tailored to their specific needs.
If you want to discuss the possibility of working with me:
Plotting Orders on a Chart
Let’s begin our work today with a simple task.
We will start by plotting orders on a chart. We want to see the execution of our model, as efficiently as we can. Later on I want to go further by adding a table containing all the trades, click on those trades and see their execution in a popup chart. But that’s for later!
The first thing we have to do is to create another tab, that will be used to analyze different strategies and later on to deploy them.
I went ahead and created the “Backtesting Dashboard” tab.
In this tab we’ll have a bunch of features that will help us analyze different trading strategies:
Closed Positions Analysis
Open Positions Analysis
Cost Analysis
Equity Curve
Performance Statistics
Let’s call this our base of operations where we control all of our models. It needs to be extremely robust.
As I build this, I am very aware of the complexity that this is already taking. I am being very careful by compartmentalizing different aspects of the code, so that if one thing breaks, it doesn’t cause a chain reaction and break our live model. This will all be documented later on.
Now we have our orders in the chart above. How does this help us?
When I am building a model, I always check the actual trades that the model is taking, on a chart. It’s a final manual check, to see if the code is doing what I actually built it to do.
Never completely trust your code. Always make sure to have manual checks in place, because many things aren’t going to work out as you expect them to.
A chart helps to give context to what we’re trading. If an order is out of place, we need to figure out why is that the case.
Single-Strategy Backtesting
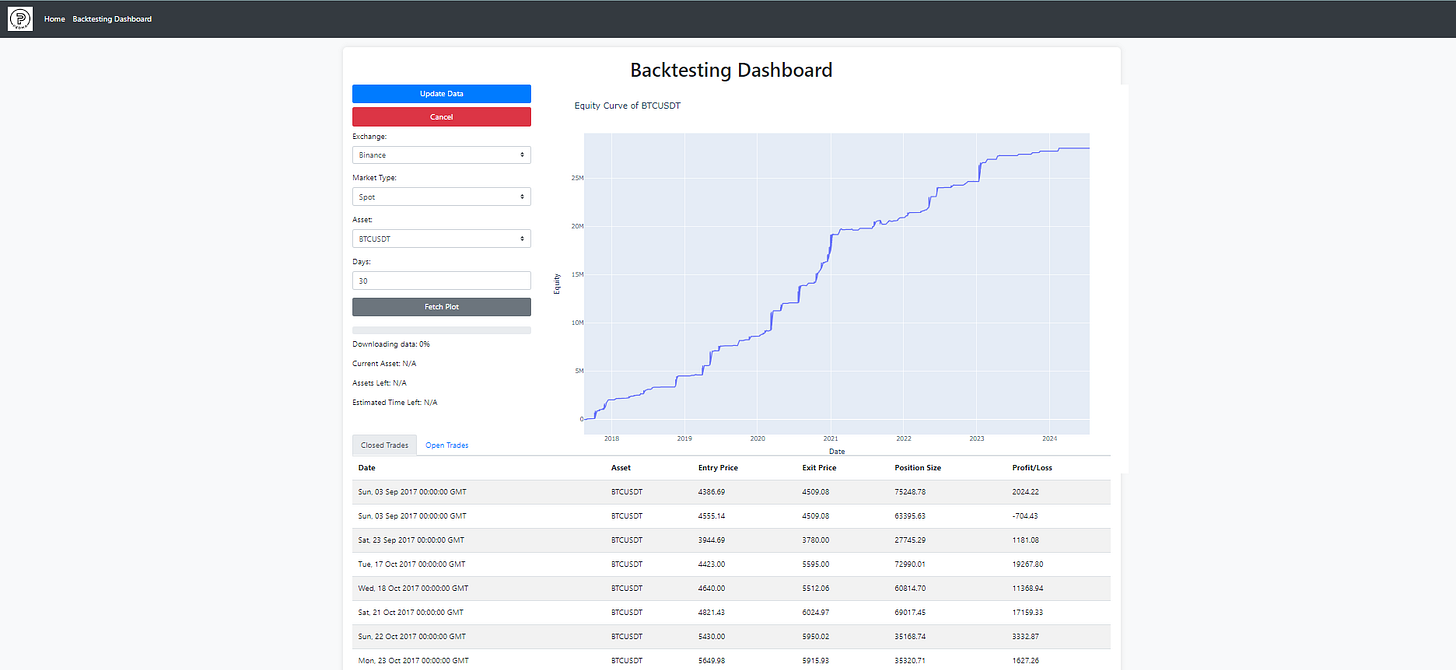
Next step is to visualize the returns of the strategy and also have all the trades organized in a table below the chart, so that we can look into them as we test all different kinds of strategies.
I want to point out that it is obvious that something is wrong with the model below, just by looking at the equity curve. There’s no linear equity curves in our line of business, but that will be fixed.
Ok we’ve achieved some very basic form of backtesting software above. We get an equity curve, and we get some trades. This is getting some shape now.
There’s still a few things missing that I’d like to have.
I want to be able to:
Sort the trades on the table by a simple click of a column header
Visualize only a set number of trades per page (right now it’s displaying too much)
Adding buttons for different functions like displaying the equity curve vs other plots
Adding Features to the Backtesting Tab
As I was building this, I got into a few different “rabbit holes” (as we call them), that took me a bunch of hours to solve, and I wasn’t able to.
One of them was clicking on trades to popup a window with the execution on a chart.
These things are cool to have but it reminded me of a very important concept in our business, and I think for any business. We need to focus on the goal and not get stuck on making things pretty or the next cool feature.
“Move fast and break things.” Mark Zuckerberg
The target is to deploy a live model , as fast and robustly as possible right? So let’s focus on that.
We can always hire someone to make our apps more beautiful and with more features in the future, but we can not hire someone to build us a profitable model. That is done with the market experience we’ve acquired.
So let’s focus on being practical!
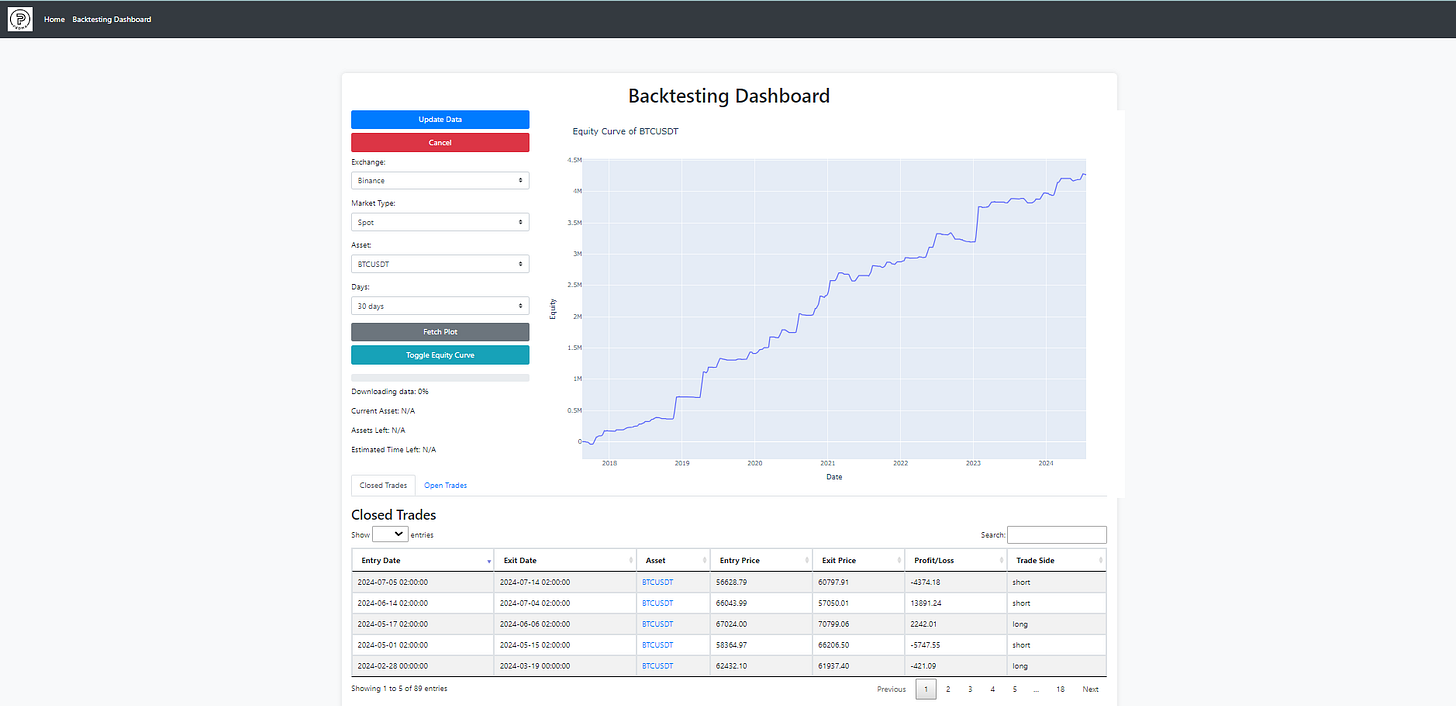
Ok we fixed a bunch of things we previously had wrong:
We are now only seeing a set number of trades being displayed, so that is is more efficient on the resources.
Also we are able now to sort the trades by any of the columns that we need.
We can also search for trades.
Portfolio size is now adjustable.
Good, it’s gaining a decent shape, and it’s start to look more and more as something I’d actually work with.
But there’s still a lot of work to do.
Fixing Strategy Results
The next step is to fix the results of our model. The model obviously wasn’t working as we wanted it to. Here’s the result from that fix.
We can now see that it is modeling the actual trend following strategy that we wanted. We are working with a long/short model, very similar to what I wrote about in the last research article:
Right now it is only trading Bitcoin, and we will be adding to the model the capability of handling a large universe of assets later this week, but right now I only had time for this update.
The implementation of multi-asset trading will be an easy step as we have built that in previous research articles!
Next Steps
I am very happy about what we’ve achieved today. It took me a bunch of hours in the weekend because I was not as efficient as I could be with my time allocation. Like I said previously, I want to focus on getting the ultimate objective done, rather than worrying how pretty and functional the dashboard is.
The list of tasks below, summarize what we need to do next, to achieve that ultimate goal:
Making the model functional for a multi-asset portfolio.
Adding a multi-choice functionality to strategy selection, to analyze efficiently across strategies (maybe group them together in the future).
Adding a detailed tab on cost analysis.
Adding a table in the side of the chart with performance statistics.
Begin the initial steps of deploying these strategies into Binance or Hyperliquid (or both).
I don’t think that there’s many people doing this work live, but that’s why I am here.
I am a practitioner of the game, and I love the actual business of trading. Too many people get stuck on the theoretical aspects of the game. I want to show you the practical side of this business.
It will be a tough road ahead, but I hope that you join me on this journey.
Disclaimer: The content and information provided by the Trading Research Hub, including all other materials, are for educational and informational purposes only and should not be considered financial advice or a recommendation to buy or sell any type of security or investment. Always conduct your own research and consult with a licensed financial professional before making any investment decisions. Trading and investing can involve significant risk of loss, and you should understand these risks before making any financial decisions.


Hi Pedma, do you know about Vectorbt pro ? you can achieve this type of dashboard using it, there's also a guy who did it on youtube using vbt. Hope it helps.